Page 231 - Modern Control of DC-Based Power Systems
P. 231

Control Approaches for Parallel Source Converter Systems     195


                                      Bode diagram
                 100
                                                                          S
                Magnitude (dB)  0
                                                                          W e
                 50

                 –50
                –100
                 90
                Phase (deg)  45 0


                 –45
                 –90
                  10 –3   10 –2   10 –1    10 0    10 1    10 2    10 3    10 4
                                         Frequency (Hz)
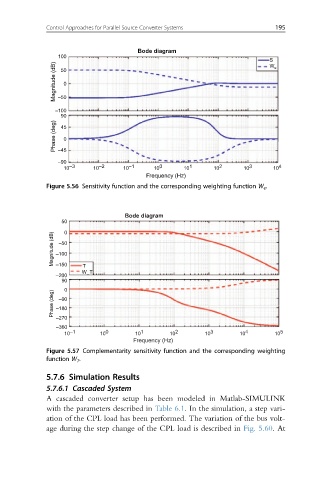
              Figure 5.56 Sensitivity function and the corresponding weighting function W e .


                                   Bode diagram
                  50 0
               Magnitude (dB)  –100
                 –50

                –150
                       T
                       W_T
                –200
                  90 0
               Phase (deg)  –180
                 –90

                –270
                –360
                    –1        0        1        2         3        4         5
                  10        10        10       10       10        10       10
                                     Frequency (Hz)
              Figure 5.57 Complementarity sensitivity function and the corresponding weighting
              function W T .

              5.7.6 Simulation Results
              5.7.6.1 Cascaded System
              A cascaded converter setup has been modeled in Matlab-SIMULINK
              with the parameters described in Table 6.1. In the simulation, a step vari-
              ation of the CPL load has been performed. The variation of the bus volt-
              age during the step change of the CPL load is described in Fig. 5.60.At
   226   227   228   229   230   231   232   233   234   235   236