
Page 76 - MODERN ELECTROCHEMISTRY
P. 76
20 CHAPTER 1
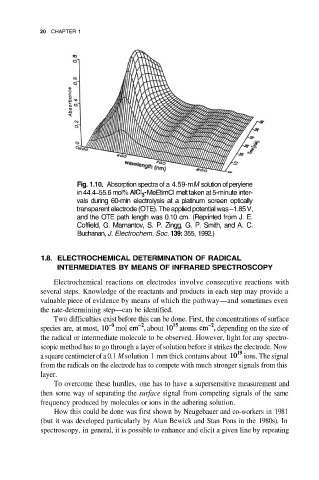
Fig. 1.10. Absorption spectra of a 4.59-mM solution of perylene
in 44.4–55.6 mol% MeEtimCI melt taken at 5-minute inter-
vals during 60-min electrolysis at a platinum screen optically
transparent electrode (OTE). The applied potential was –1.85 V,
and the OTE path length was 0.10 cm. (Reprinted from J. E.
Coffield, G. Mamantov, S. P. Zingg, G. P. Smith, and A. C.
Buchanan, J. Electrochem. Soc. 139: 355, 1992.)
1.8. ELECTROCHEMICAL DETERMINATION OF RADICAL
INTERMEDIATES BY MEANS OF INFRARED SPECTROSCOPY
Electrochemical reactions on electrodes involve consecutive reactions with
several steps. Knowledge of the reactants and products in each step may provide a
valuable piece of evidence by means of which the pathway—and sometimes even
the rate-determining step—can be identified.
Two difficulties exist before this can be done. First, the concentrations of surface
species are, at most, mol about atoms depending on the size of
the radical or intermediate molecule to be observed. However, light for any spectro-
scopic method has to go through a layer of solution before it strikes the electrode. Now
a square centimeter of a 0.1 M solution 1 mm thick contains about ions. The signal
from the radicals on the electrode has to compete with much stronger signals from this
layer.
To overcome these hurdles, one has to have a supersensitive measurement and
then some way of separating the surface signal from competing signals of the same
frequency produced by molecules or ions in the adhering solution.
How this could be done was first shown by Neugebauer and co-workers in 1981
(but it was developed particularly by Alan Bewick and Stan Pons in the 1980s). In
spectroscopy, in general, it is possible to enhance and elicit a given line by repeating