
Page 171 - Modern Spatiotemporal Geostatistics
P. 171
152 Modern Spatiotemporal Geostatistics — Chapter 8
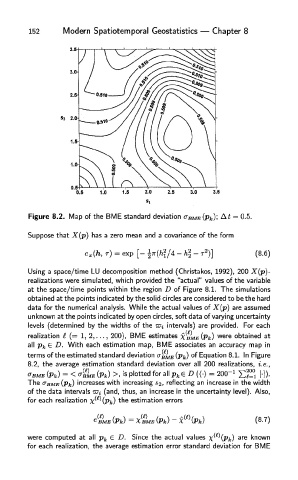
Figure 8.2. Map of the BME standard deviation (?BME(Pk)> Ai = 0.5.
Suppose that X(p) has a zero mean and a covariance of the form
d
LU decomposition
metho
1992)
(Christakos,
200
X(p)-
Usin g a space/tim e L U decompositio n method (Christakos , 1992), , 20 0 X(p)-
Using a space/time
provide
d
value
e
th
"actual"
variabl
e
th
realization s wer e simulated , whic h provided the "actual " values of the variable
realizations were simulated, which
e
f
s
o
point
the
s
within
region
e
Th
s
simulation
8.1.
o
D
e
Figur
space/time
the
at at th e space/tim e points withi n th e regio n D of f Figure 8.1 . The simulations
th
soli
d
s
e
point
circle
d
obtaine
b
y
b
d
o
t
e
indicate
e
th
e
obtained at the points indicated by the solid circles are considered to be the hard
considere
t
ar
d
d
s
a
har
th
e
Whil
the
fo
data
actua
l
are assumed
value
e
dat a for r th e numerica l analysis . While the actual values of X(p) ar e assume d
th
o
s
X(p)
numerical analysis.
f
e
by open circles, soft data of varying uncertainty
d
unknown at the points indicated b y ope n circles , sof t dat a o f varyin g uncertaint y
s
t
th
indicate
e
unknow
point
a
n
ar
b
e
Wi
d
provided.
intervals
each
levels
e
(determine
width
level s (determined by y the widths o f th e Wi intervals) ) are provided . Fo r eac h
s
th
For
the
of
=
s
I
n
,
estimate
2,...
realization I ( (= 1,2,..., 200), , BME estimates X were obtained at
E
realizatio
1
,
200)
BM
all p € D.. Wit eac estimationn map,, BMEE associatess an accuracyy map inn
D
i
accurac
n
a
p
ma
Withh
associate
eachh
€
map
estimatio
BM
all p kk
o
d
deviatio
n
n
8.1
s
.
e
estimate
th
e
f
I
standar
d
Figur
n
°
(Pk)
E
f
term
terms of the estimated standard deviation O^ME (Pk) °f Equation 8.1. In Figure
O^M
Equatio
all
8.2, the average estimation standard deviation over all 2000 realizations, i.e.,
8.2,
estimation
20
average
the
realizations,
over
i.e
standard deviation
>• * plotted for
The a BME (Pk)
The a BME (Pk) increases with increasing S2, reflecting an increase in the width
increases with increasing S2, reflecting an increase in the width
Also,
of the data intervals w^ (and, thus, an increase in the uncertainty level). Also,
(and, thus, an increase in the
level).
of the
uncertainty
data intervals w^
realization x^\Pk)
errors
each
for
for each realization x^\Pk) the estimation errors
the estimation
were computed at all pk e D. Since the actual values x^(Pk) are known
for each realization, the average estimation error standard deviation for BME