
Page 172 - Modern Spatiotemporal Geostatistics
P. 172
Uncertainty Assessment 153
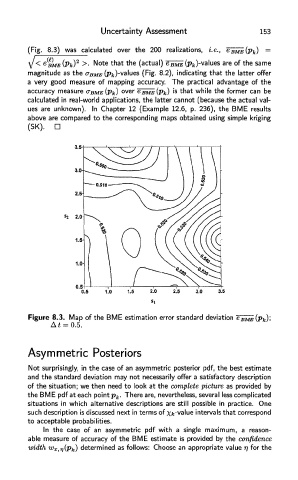
(Fig. 8.3) was calculated over the 200 realizations, i.e.,
Note that the (actual) e BMB(p fe)-values are of the same
magnitude as the a BME (p fe)-values (Fig. 8.2), indicating that the latter offer
a very good measure of mapping accuracy. The practical advantage of the
accuracy measure (TBME(Pk) over ^BMs(pk) 's tnat while the former can be
calculated in real-world applications, the latter cannot (because the actual val-
ues are unknown). In Chapter 12 (Example 12.6, p. 236), the BME results
above are compared to the corresponding maps obtained using simple kriging
(SK). D
Figure 8.3. Map of the BME estimation error standard deviation
Asymmetric Posteriors
Not surprisingly, in the case of an asymmetric posterior pdf, the best estimate
and the standard deviation may not necessarily offer a satisfactory description
of the situation; we then need to look at the complete picture as provided by
the BME pdf at each point p k. There are, nevertheless, several less complicated
situations in which alternative descriptions are still possible in practice. One
such description is discussed next in terms of Xfc-value intervals that correspond
to acceptable probabilities.
In the case of an asymmetric pdf with a single maximum, a reason-
able measure of accuracy of the BME estimate is provided by the confidence
width w x<rj(p k) determined as follows: Choose an appropriate value r/ for the