
Page 175 - Modern Spatiotemporal Geostatistics
P. 175
156 Modern Spatiotemporal Geostatistics — Chapter 8
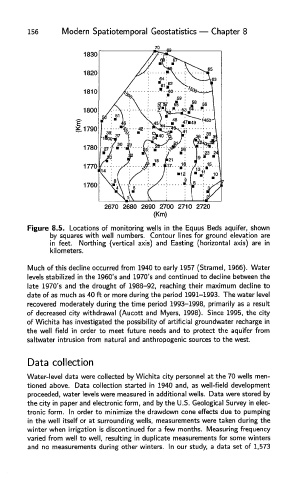
Figure 8.5. Locations of monitoring wells in the Equus Beds aquifer, shown
by squares with well numbers. Contour lines for ground elevation are
in feet. Northing (vertical axis) and Easting (horizontal axis) are in
kilometers.
Much of this decline occurred from 1940 to early 1957 (Stramel, 1966). Water
levels stabilized in the 1960's and 1970's and continued to decline between the
late 1970's and the drought of 1988-92, reaching their maximum decline to
date of as much as 40 ft or more during the period 1991-1993. The water level
recovered moderately during the time period 1993-1998, primarily as a result
of decreased city withdrawal (Aucott and Myers, 1998). Since 1995, the city
of Wichita has investigated the possibility of artificial groundwater recharge in
the well field in order to meet future needs and to protect the aquifer from
saltwater intrusion from natural and anthropogenic sources to the west.
Data collection
Water-level data were collected by Wichita city personnel at the 70 wells men-
tioned above. Data collection started in 1940 and, as well-field development
proceeded, water levels were measured in additional wells. Data were stored by
the city in paper and electronic form, and by the U.S. Geological Survey in elec-
tronic form. In order to minimize the drawdown cone effects due to pumping
in the well itself or at surrounding wells, measurements were taken during the
winter when irrigation is discontinued for a few months. Measuring frequency
varied from well to well, resulting in duplicate measurements for some winters
and no measurements during other winters. In our study, a data set of 1,573