
Page 180 - Modern Spatiotemporal Geostatistics
P. 180
Uncertainty Assessment 161
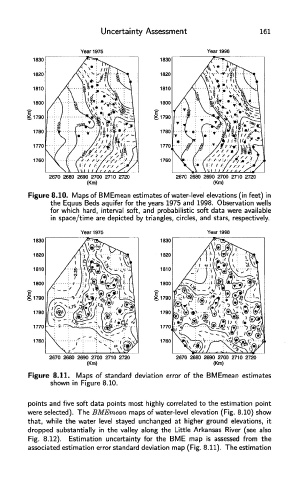
Figure 8.10. Maps of BMEmean estimates of water-level elevations (in feet) in
the Equus Beds aquifer for the years 1975 and 1998. Observation wells
for which hard, interval soft, and probabilistic soft data were available
in space/time are depicted by triangles, circles, and stars, respectively.
Figure 8.11. Maps of standard deviation error of the BMEmean estimates
shown in Figure 8.10.
points and five soft data points most highly correlated to the estimation point
were selected). The BMEmean maps of water-level elevation (Fig. 8.10) show
that, while the water level stayed unchanged at higher ground elevations, it
dropped substantially in the valley along the Little Arkansas River (see also
Fig. 8.12). Estimation uncertainty for the BME map is assessed from the
associated estimation error standard deviation map (Fig. 8.11). The estimation