
Page 178 - Modern Spatiotemporal Geostatistics
P. 178
Uncertainty Assessment 159
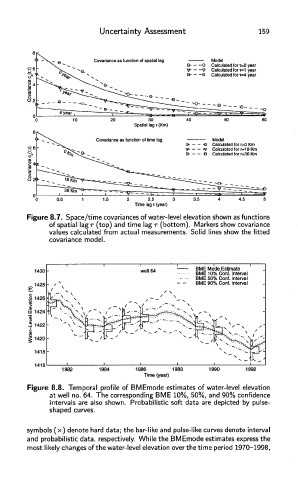
Figure 8.7. Space/time covariances of water-level elevation shown as functions
of spatial lag r (top) and time lag r (bottom). Markers show covariance
values calculated from actual measurements. Solid lines show the fitted
covariance model.
Figure 8.8. Temporal profile of BMEmode estimates of water-level elevation
at well no. 64. The corresponding BME 10%, 50%, and 90% confidence
intervals are also shown. Probabilistic soft data are depicted by pulse-
shaped curves.
symbols (x) denote hard data; the bar-like and pulse-like curves denote interval
and probabilistic data, respectively. While the BMEmode estimates express the
most likely changes of the water-level elevation over the time period 1970-1998,