
Page 176 - Modern Spatiotemporal Geostatistics
P. 176
Uncertainty Assessment 157
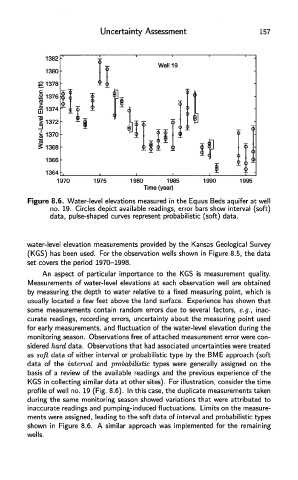
Figure 8.6. Water-level elevations measured in the Equus Beds aquifer at well
no. 19. Circles depict available readings, error bars show interval (soft)
data, pulse-shaped curves represent probabilistic (soft) data.
water-level elevation measurements provided by the Kansas Geological Survey
(KGS) has been used. For the observation wells shown in Figure 8.5, the data
set covers the period 1970-1998.
An aspect of particular importance to the KGS is measurement quality.
Measurements of water-level elevations at each observation well are obtained
by measuring the depth to water relative to a fixed measuring point, which is
usually located a few feet above the land surface. Experience has shown that
some measurements contain random errors due to several factors, e.g., inac-
curate readings, recording errors, uncertainty about the measuring point used
for early measurements, and fluctuation of the water-level elevation during the
monitoring season. Observations free of attached measurement error were con-
sidered hard data. Observations that had associated uncertainties were treated
as soft data of either interval or probabilistic type by the BME approach (soft
data of the interval and probabilistic types were generally assigned on the
basis of a review of the available readings and the previous experience of the
KGS in collecting similar data at other sites). For illustration, consider the time
profile of well no. 19 (Fig. 8.6). In this case, the duplicate measurements taken
during the same monitoring season showed variations that were attributed to
inaccurate readings and pumping-induced fluctuations. Limits on the measure-
ments were assigned, leading to the soft data of interval and probabilistic types
shown in Figure 8.6. A similar approach was implemented for the remaining
wells.