
Page 179 - Modern Spatiotemporal Geostatistics
P. 179
160 Modern Spatiotemporal Geostatistics — Chapter 8
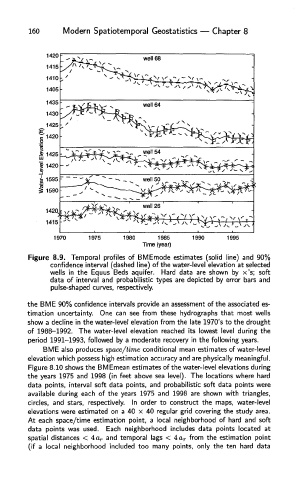
Figure 8.9. Temporal profiles of BMEmode estimates (solid line) and 90%
confidence interval (dashed line) of the water-level elevation at selected
wells in the Equus Beds aquifer. Hard data are shown by x's; soft
data of interval and probabilistic types are depicted by error bars and
pulse-shaped curves, respectively.
the BME 90% confidence intervals provide an assessment of the associated es-
timation uncertainty. One can see from these hydrographs that most wells
show a decline in the water-level elevation from the late 1970's to the drought
of 1988-1992. The water-level elevation reached its lowest level during the
period 1991-1993, followed by a moderate recovery in the following years.
BME also produces space/time conditional mean estimates of water-level
elevation which possess high estimation accuracy and are physically meaningful.
Figure 8.10 shows the BMEmean estimates of the water-level elevations during
the years 1975 and 1998 (in feet above sea level). The locations where hard
data points, interval soft data points, and probabilistic soft data points were
available during each of the years 1975 and 1998 are shown with triangles,
circles, and stars, respectively. In order to construct the maps, water-level
elevations were estimated on a 40 x 40 regular grid covering the study area.
At each space/time estimation point, a local neighborhood of hard and soft
data points was used. Each neighborhood includes data points located at
spatial distances < 4a r and temporal lags < 4a T from the estimation point
(if a local neighborhood included too many points, only the ten hard data