
Page 22 - Modern Spatiotemporal Geostatistics
P. 22
Spatiotemporal Mapping in Natural Sciences 3
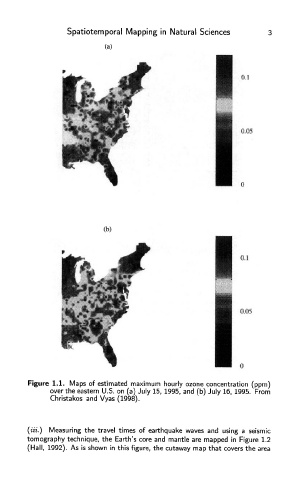
Figure 1.1. Maps of estimated maximum hourly ozone concentration (ppm)
over the eastern U.S. on (a) July 15, 1995, and (b) July 16, 1995. From
Christakos and Vyas (1998).
(iii.) Measuring the travel times of earthquake waves and using a seismic
tomography technique, the Earth's core and mantle are mapped in Figure 1.2
(Hall, 1992). As is shown in this figure, the cutaway map that covers the area