
Page 23 - Modern Spatiotemporal Geostatistics
P. 23
4 Modern Spatiotemporal Geostatistics — Chapter 1
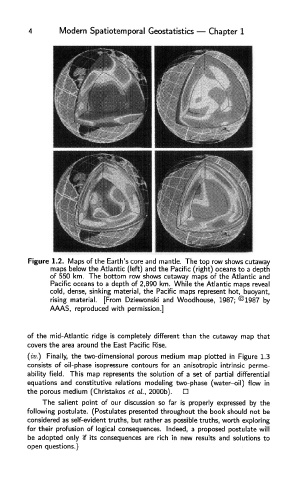
Figure 1.2. Maps of the Earth's core and mantle. The top row shows cutaway
maps below the Atlantic (left) and the Pacific (right) oceans to a depth
of 550 km. The bottom row shows cutaway maps of the Atlantic and
Pacific oceans to a depth of 2,890 km. While the Atlantic maps reveal
cold, dense, sinking material, the Pacific maps represent hot, buoyant,
rising material. [From Dziewonski and Woodhouse, 1987; ©1987 by
AAAS, reproduced with permission.]
of the mid-Atlantic ridge is completely different than the cutaway map that
covers the area around the East Pacific Rise.
(iv.) Finally, the two-dimensional porous medium map plotted in Figure 1.3
consists of oil-phase isopressure contours for an anisotropic intrinsic perme-
ability field. This map represents the solution of a set of partial differential
equations and constitutive relations modeling two-phase (water-oil) flow in
the porous medium (Christakos et al., 2000b).
The salient point of our discussion so far is properly expressed by the
following postulate. (Postulates presented throughout the book should not be
considered as self-evident truths, but rather as possible truths, worth exploring
for their profusion of logical consequences. Indeed, a proposed postulate will
be adopted only if its consequences are rich in new results and solutions to
open questions.)