
Page 26 - Modern Spatiotemporal Geostatistics
P. 26
Spatiotemporal Mapping in Natural Sciences 7
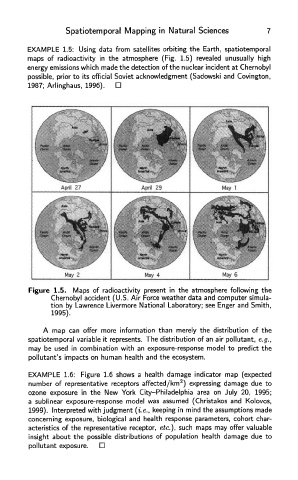
EXAMPLE 1.5: Using data from satellites orbiting the Earth, spatiotemporal
maps of radioactivity in the atmosphere (Fig. 1.5) revealed unusually high
energy emissions which made the detection of the nuclear incident at Chernobyl
possible, prior to its official Soviet acknowledgment (Sadowski and Covington,
1987; Arlinghaus, 1996).
Figure 1.5. Maps of radioactivity present in the atmosphere following the
Chernobyl accident (U.S. Air Force weather data and computer simula-
tion by Lawrence Livermore National Laboratory; see Enger and Smith,
1995).
A map can offer more information than merely the distribution of the
spatiotemporal variable it represents. The distribution of an air pollutant, e.g.,
may be used in combination with an exposure-response model to predict the
pollutant's impacts on human health and the ecosystem.
EXAMPLE 1.6: Figure 1.6 shows a health damage indicator map (expected
2
number of representative receptors affected/km ) expressing damage due to
ozone exposure in the New York City-Philadelphia area on July 20, 1995;
a sublinear exposure-response model was assumed (Christakos and Kolovos,
1999). Interpreted with judgment (i.e., keeping in mind the assumptions made
concerning exposure, biological and health response parameters, cohort char-
acteristics of the representative receptor, etc.), such maps may offer valuable
insight about the possible distributions of population health damage due to
pollutant exposure.