
Page 24 - Modern Spatiotemporal Geostatistics
P. 24
Spatiotemporal Mapping in Natural Sciences 5
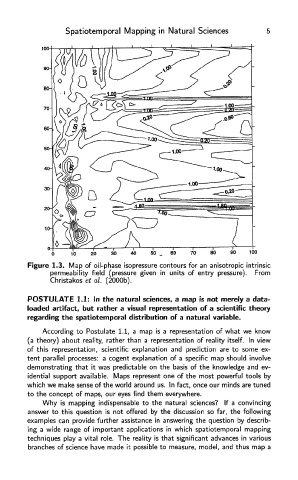
Figure 1.3. Map of oil-phase isopressure contours for an anisotropic intrinsic
permeability field (pressure given in units of entry pressure). From
Christakos et al. (2000b).
POSTULATE 1.1: In the natural sciences, a map is not merely a data-
loaded artifact, but rather a visual representation of a scientific theory
regarding the spatiotemporal distribution of a natural variable.
According to Postulate 1.1, a map is a representation of what we know
(a theory) about reality, rather than a representation of reality itself. In view
of this representation, scientific explanation and prediction are to some ex-
tent parallel processes: a cogent explanation of a specific map should involve
demonstrating that it was predictable on the basis of the knowledge and ev-
idential support available. Maps represent one of the most powerful tools by
which we make sense of the world around us. In fact, once our minds are tuned
to the concept of maps, our eyes find them everywhere.
Why is mapping indispensable to the natural sciences? If a convincing
answer to this question is not offered by the discussion so far, the following
examples can provide further assistance in answering the question by describ-
ing a wide range of important applications in which spatiotemporal mapping
techniques play a vital role. The reality is that significant advances in various
branches of science have made it possible to measure, model, and thus map a