
Page 27 - Modern Spatiotemporal Geostatistics
P. 27
8 Modern Spatiotemporal Geostatistics — Chapter 1
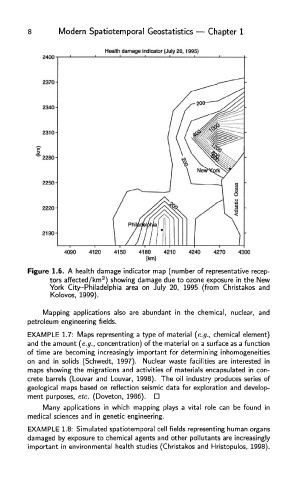
Figure 1.6. A health damage indicator map (number of representative recep-
2
tors affected/km ) showing damage due to ozone exposure in the New
York City-Philadelphia area on July 20, 1995 (from Christakos and
Kolovos, 1999).
Mapping applications also are abundant in the chemical, nuclear, and
petroleum engineering fields.
EXAMPLE 1.7: Maps representing a type of material (e.g., chemical element)
and the amount (e.g., concentration) of the material on a surface as a function
of time are becoming increasingly important for determining inhomogeneities
on and in solids (Schwedt, 1997). Nuclear waste facilities are interested in
maps showing the migrations and activities of materials encapsulated in con-
crete barrels (Louvar and Louvar, 1998). The oil industry produces series of
geological maps based on reflection seismic data for exploration and develop-
ment purposes, etc. (Doveton, 1986).
Many applications in which mapping plays a vital role can be found in
medical sciences and in genetic engineering.
EXAMPLE 1.8: Simulated spatiotemporal cell fields representing human organs
damaged by exposure to chemical agents and other pollutants are increasingly
important in environmental health studies (Christakos and Hristopulos, 1998).