
Page 25 - Modern Spatiotemporal Geostatistics
P. 25
6 Modern Spatiotemporal Geostatistics — Chapter 1
breathtaking range of spatiotemporal domains. Examples 1.2-1.5 below refer
to the various uses of maps in agricultural, forestry, and environmental studies.
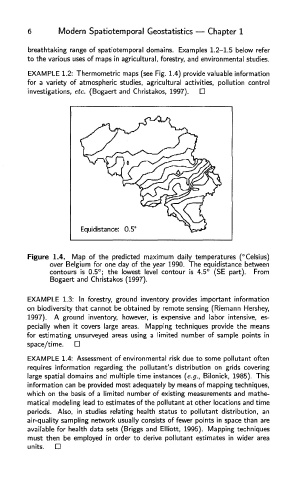
EXAMPLE 1.2: Thermometric maps (see Fig. 1.4) provide valuable information
for a variety of atmospheric studies, agricultural activities, pollution control
investigations, etc. (Bogaert and Christakos, 1997).
Figure 1.4. Map of the predicted maximum daily temperatures (°Celsius)
over Belgium for one day of the year 1990. The equidistance between
contours is 0.5°; the lowest level contour is 4.5° (SE part). From
Bogaert and Christakos (1997).
EXAMPLE 1.3: In forestry, ground inventory provides important information
on biodiversity that cannot be obtained by remote sensing (Riemann Hershey,
1997). A ground inventory, however, is expensive and labor intensive, es-
pecially when it covers large areas. Mapping techniques provide the means
for estimating unsurveyed areas using a limited number of sample points in
space/time.
EXAMPLE 1.4: Assessment of environmental risk due to some pollutant often
requires information regarding the pollutant's distribution on grids covering
large spatial domains and multiple time instances (e.g., Bilonick, 1985). This
information can be provided most adequately by means of mapping techniques,
which on the basis of a limited number of existing measurements and mathe-
matical modeling lead to estimates of the pollutant at other locations and time
periods. Also, in studies relating health status to pollutant distribution, an
air-quality sampling network usually consists of fewer points in space than are
available for health data sets (Briggs and Elliott, 1995). Mapping techniques
must then be employed in order to derive pollutant estimates in wider area
units.