
Page 28 - Modern Spatiotemporal Geostatistics
P. 28
Spatiotemporal Mapping in Natural Sciences 9
Figure 1.7. A simulated spatiotemporal cell field for a target organ. The
affected cells are white and the normal cells are black; some repair is
taking place, as well (from Christakos and Hristopulos, 1998).
Spatial maps simulating cell distribution at different times are shown in Figure
1.7. Note the change in number of normal cells (black) vs. affected cells
(white) in space/time (some of the affected cells are repaired in time). These
maps take into consideration the spatial and temporal correlations between
cells.
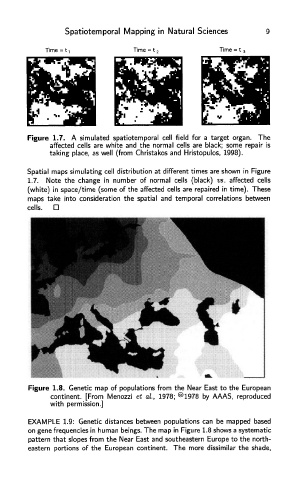
Figure 1.8. Genetic map of populations from the Near East to the European
continent. [From Menozzi et al, 1978; ©1978 by AAAS, reproduced
with permission.]
EXAMPLE 1.9: Genetic distances between populations can be mapped based
on gene frequencies in human beings. The map in Figure 1.8 shows a systematic
pattern that slopes from the Near East and southeastern Europe to the north-
eastern portions of the European continent. The more dissimilar the shade,