
Page 123 - Modern physical chemistry
P. 123
114 Relationships between Phases
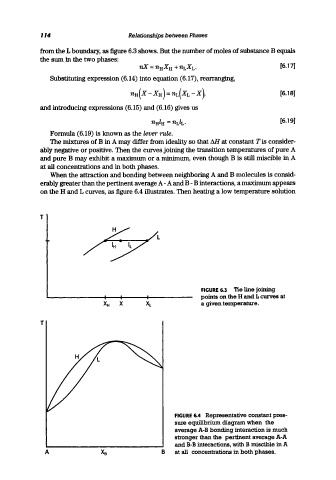
from the L boundary, as figure 6.3 shows. But the number of moles of substance B equals
the sum in the two phases:
nX =nHXH +nLXL. [6.17]
Substituting expression (6.14) into equation (6.17), rearranging,
nH(X -xH)=nL(XL -x), [6.18]
and introducing expressions (6.15) and (6.16) gives us
[6.19]
Formula (6.19) is known as the lever rule.
The mixtures of B in A may differ from ideality so that MI at constant T is consider-
ably negative or positive. Then the curves joining the transition temperatures of pure A
and pure B may exhibit a maximum or a minimum, even though B is still miscible in A
at all concentrations and in both phases.
When the attraction and bonding between neighboring A and B molecules is consid-
erably greater than the pertinent average A -A and B -B interactions, a maximum appears
on the H and L curves, as figure 6.4 illustrates. Then heating a low temperature solution
T
L
FIGURE 6.3 Tie line joining
points on the H and L curves at
'4i X a given temperature.
T
FIGURE 6.4 Representative constant pres-
sure equilibrium diagram when the
average A-B bonding interaction is much
stronger than the pertinent average A-A
and B-B interactions, with B miscible in A
A B at all concentrations in both phases.