
Page 128 - Modern physical chemistry
P. 128
6.6 Singularities Separating Phases 119
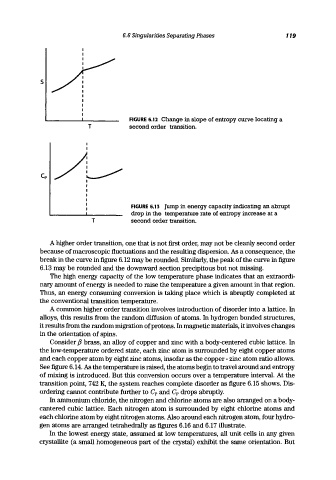
FIGURE 6.12 Change in slope of entropy curve locating a
T second order transition.
I
c,/v
I
I
FIGURE 6.13 Jump in energy capacity indicating an abrupt
drop in the temperature rate of entropy increase at a
T second order transition.
A higher order transition, one that is not first order, may not be cleanly second order
because of macroscopic fluctuations and the resulting dispersion. As a consequence, the
break in the curve in figure 6.12 may be rounded. Similarly, the peak of the curve in figure
6.13 may be rounded and the downward section precipitous but not missing.
The high energy capacity of the low temperature phase indicates that an extraordi-
nary amount of energy is needed to raise the temperature a given amount in that region.
Thus, an energy consuming conversion is taking place which is abruptly completed at
the conventional transition temperature.
A common higher order transition involves introduction of disorder into a lattice. In
alloys, this results from the random diffusion of atoms. In hydrogen bonded structures,
it results from the random migration of protons. In magnetic materials, it involves changes
in the orientation of spins.
Consider f3 brass, an alloy of copper and zinc with a body-centered cubic lattice. In
the low-temperature ordered state, each zinc atom is surrounded by eight copper atoms
and each copper atom by eight zinc atoms, insofar as the copper -zinc atom ratio allows.
See figure 6.14. As the temperature is raised, the atoms begin to travel around and entropy
of mixing is introduced. But this conversion occurs over a temperature interval. At the
transition point, 742 K, the system reaches complete disorder as figure 6.15 shows. Dis-
ordering cannot contribute further to C p and C p drops abruptly.
In ammonium chloride, the nitrogen and chlorine atoms are also arranged on a body-
cantered cubic lattice. Each nitrogen atom is surrounded by eight chlorine atoms and
each chlorine atom by eight nitrogen atoms. Also around each nitrogen atom, four hydro-
gen atoms are arranged tetrahedrally as figures 6.16 and 6.17 illustrate.
In the lowest energy state, assumed at low temperatures, all unit cells in any given
crystallite (a small homogeneous part of the crystal) exhibit the same orientation. But