
Page 232 - Book Hosokawa Nanoparticle Technology Handbook
P. 232
FUNDAMENTALS CH. 4 CONTROL OF NANOSTRUCTURE OF MATERIALS
(2) Active TPB area where n is total number of particles per unit volume,
t
Figure 4.4.9 shows a schematic illustration of the TPB n and n are number fraction of electronic and ionic
io
el
formed after heat treatment at contacts between the particles, respectively, z the average coordination
i
particles of different types. If we assume that the number of i-component, z el/io number of ionic parti-
active area derived from the formed TPB is the con- cles in contact with electronic particles. Some results
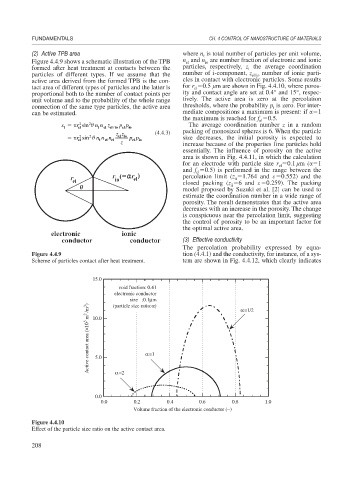
tact area of different types of particles and the latter is for r 0.5 m are shown in Fig. 4.4.10, where poros-
el
proportional both to the number of contact points per ity and contact angle are set at 0.4° and 15°, respec-
unit volume and to the probability of the whole range tively. The active area is zero at the percolation
connection of the same type particles, the active area thresholds, where the probability p is zero. For inter-
i
can be estimated. mediate compositions a maximum is present: if 1
the maximum is reached for f 0.5.
el
2
s sin 2 n n z p p io The average coordination number z in a random
r
el
el el io
t
el
t
zz (4.4.3) packing of monosized spheres is 6. When the particle
2
r sin 2 n n n el io p p io size decreases, the initial porosity is expected to
l
el
el el
el
t
z increase because of the properties fine particles hold
essentially. The influence of porosity on the active
area is shown in Fig. 4.4.11, in which the calculation
for an electrode with particle size r 0.1 m ( 1
el
and f 0.5) is performed in the range between the
el
percolation limit (z 1.764 and 0.552) and the
ii
closed packing (z 6 and 0.259). The packing
ii
model proposed by Suzuki et al. [2] can be used to
estimate the coordination number in a wide range of
porosity. The result demonstrates that the active area
decreases with an increase in the porosity. The change
is conspicuous near the percolation limit, suggesting
the control of porosity to be an important factor for
the optimal active area.
(3) Effective conductivity
The percolation probability expressed by equa-
Figure 4.4.9 tion (4.4.1) and the conductivity, for instance, of a sys-
Scheme of particles contact after heat treatment. tem are shown in Fig. 4.4.12, which clearly indicates
15.0
void fraction: 0.41
electronic conductor
size :0.1μm α=1/2
Active contact area (×10 5 m 2 /m 3 ) 5.0 α=1
(particle size ratio:α)
10.0
0.0 α=2
0.0 0.2 0.4 0.6 0.8 1.0
Volume fraction of the electronic conductor (−)
Figure 4.4.10
Effect of the particle size ratio on the active contact area.
208