
Page 279 - Book Hosokawa Nanoparticle Technology Handbook
P. 279
FUNDAMENTALS CH. 4 CONTROL OF NANOSTRUCTURE OF MATERIALS
0.8
(c)
0.6 (f)
IOF 0.4 (e)
(d)
(b)
0.2
(a)
0.0
0.0 0.2 0.4 0.6 0.8 1.0
NBL
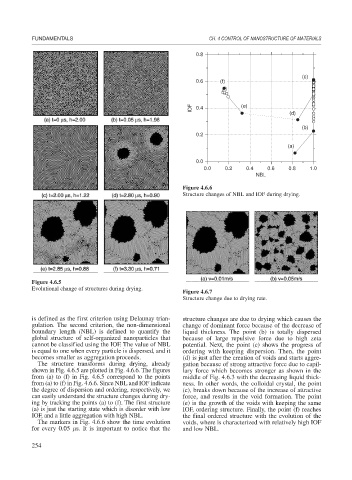
Figure 4.6.6
Structure changes of NBL and IOF during drying.
Figure 4.6.5
Evolutional change of structures during drying.
Figure 4.6.7
Structure change due to drying rate.
is defined as the first criterion using Delaunay trian- structure changes are due to drying which causes the
gulation. The second criterion, the non-dimensional change of dominant force because of the decrease of
boundary length (NBL) is defined to quantify the liquid thickness. The point (b) is totally dispersed
global structure of self-organized nanoparticles that because of large repulsive force due to high zeta
cannot be classified using the IOF. The value of NBL potential. Next, the point (c) shows the progress of
is equal to one when every particle is dispersed, and it ordering with keeping dispersion. Then, the point
becomes smaller as aggregation proceeds. (d) is just after the creation of voids and starts aggre-
The structure transforms during drying, already gation because of strong attractive force due to capil-
shown in Fig. 4.6.5 are plotted in Fig. 4.6.6. The figures lary force which becomes stronger as shown in the
from (a) to (f) in Fig. 4.6.5 correspond to the points middle of Fig. 4.6.3 with the decreasing liquid thick-
from (a) to (f) in Fig. 4.6.6. Since NBL and IOF indicate ness. In other words, the colloidal crystal, the point
the degree of dispersion and ordering, respectively, we (c), breaks down because of the increase of attractive
can easily understand the structure changes during dry- force, and results in the void formation. The point
ing by tracking the points (a) to (f). The first structure (e) is the growth of the voids with keeping the same
(a) is just the starting state which is disorder with low IOF, ordering structure. Finally, the point (f) reaches
IOF, and a little aggregation with high NBL. the final ordered structure with the evolution of the
The markers in Fig. 4.6.6 show the time evolution voids, where is characterized with relatively high IOF
for every 0.05 s. It is important to notice that the and low NBL.
254