
Page 387 - Book Hosokawa Nanoparticle Technology Handbook
P. 387
6.5 ELECTROCHEMICAL PROPERTIES FUNDAMENTALS
the mixture of several materials as described above.
With this in mind, it was difficult to accurately sepa-
rate information concerning the properties of the active
material from that concerning the total electrode. Dokko
et. al have developed a technique to measure the cyclic
voltammogram of a single particle and subsequently,
the electrochemical properties of a single particle have
come to be measured and discussed [8]. The cantilever
of the scanning probe microscope comes into contact
with the particle and functions as the working electrode.
Sharp peaks were observed in the case of the voltam-
mogram for a single particle rather than that for the
whole electrode, making it possible to evaluate the elec-
trochemical properties of the active material very accu-
rately. This fact must promote research into active
materials having a nanostructure.
6.5.1.3 AC impedance method
Figure 6.5.6
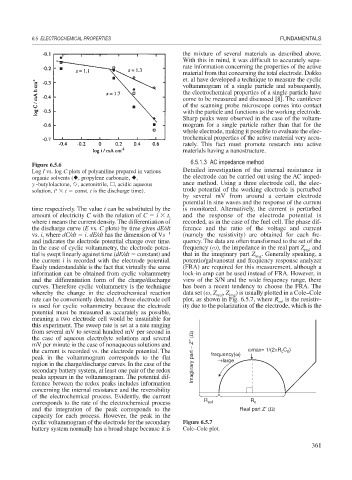
Log I vs. log C plots of polyaniline prepared in various Detailed investigation of the internal resistance in
organic solvents ( , propylene carbonate, , the electrode can be carried out using the AC imped-
-butylolactone, , acetonitrile, , acidic aqueous ance method. Using a three electrode cell, the elec-
x
solution, i t const. t is the discharge time). trode potential of the working electrode is perturbed
by several mV from around a certain electrode
potential in sine waves and the response of the current
time respectively. The value t can be substituted by the is monitored. Alternatively, the current is perturbed
amount of electricity C with the relation of C i t, and the response of the electrode potential is
where i means the current density. The differentiation of recorded, as in the case of the fuel cell. The phase dif-
the discharge curve (E vs. C plots) by time gives dE/dt ference and the ratio of the voltage and current
vs. i, where dC/dt i. dE/dt has the dimension of Vs 1 (namely the resistivity) are obtained for each fre-
and indicates the electrode potential change over time. quency. The data are often transformed to the set of the
In the case of cyclic voltammetry, the electrode poten- frequency ( ), the impedance in the real part Z real and
tial is swept linearly against time (dE/dt constant) and that in the imaginary part Z . Generally speaking, a
img
the current i is recorded with the electrode potential. potentio/galvanostat and frequency response analyzer
Easily understandable is the fact that virtually the same (FRA) are required for this measurement, although a
information can be obtained from cyclic voltammetry lock-in amp can be used instead of FRA. However, in
and the differentiation form of the charge/discharge view of the S/N and the wide frequency range, there
curves. Therefore cyclic voltammetry is the technique has been a recent tendency to choose the FRA. The
whereby the change in the electrochemical reaction data set ( , Z , Z ) is usually plotted in a Cole–Cole
img
real
rate can be conveniently detected. A three electrode cell plot, as shown in Fig. 6.5.7, where R sol is the resistiv-
is used for cyclic voltammetry because the electrode ity due to the polarization of the electrode, which is the
potential must be measured as accurately as possible,
meaning a two electrode cell would be unsuitable for
this experiment. The sweep rate is set at a rate ranging
from several mV to several hundred mV per second in
the case of aqueous electrolyte solutions and several
mV per minute in the case of nonaqueous solutions and
the current is recorded vs. the electrode potential. The frequency(ω) ωmax= 1/(2
R C )
c d
peak in the voltammogram corresponds to the flat Imaginary part − Z″ (Ω) →large
region in the charge/discharge curves. In the case of the
secondary battery system, at least one pair of the redox
peaks appears in the voltammogram. The potential dif-
ference between the redox peaks includes information
concerning the internal resistance and the reversibility
of the electrochemical process. Evidently, the current
corresponds to the rate of the electrochemical process R sol R c
and the integration of the peak corresponds to the Real part Z′ (Ω)
capacity for each process. However, the peak in the
cyclic voltammogram of the electrode for the secondary Figure 6.5.7
battery system normally has a broad shape because it is Cole–Cole plot.
361