
Page 406 - Book Hosokawa Nanoparticle Technology Handbook
P. 406
FUNDAMENTALS CH. 6 EVALUATION METHODS FOR PROPERTIES OF NANOSTRUCTURED BODY
References
[1] M. Oya, M. Takahashi, Y. Iwata, K. Jono, T. Hotta, H.
Yamamoto, K. Washio, A. Suda, Y. Matuo, K. Tanaka
and M. Morimoto: Am. Ceram. Soc. Bull., 81, 52–56
(2002).
[2] J.M. Haynes: Mater. Struct., 6(3), 209–213 (1973).
[3] JIS R 1626 Measuring methods for the specific sur-
face area of fine ceramic powders by gas adsorption
using the BET method (1996).
[4] JIS K 3832, ASTM F316-86 “Pore Size Characteristics
of Membrane Filters by Bubble Point and Mean Flow
Pore Test” (1990).
[5] S. Inoue1, S. Asaoka and M. Nakamura: Catal. Surv.
Jpn., 2(1), 87–97 (1998).
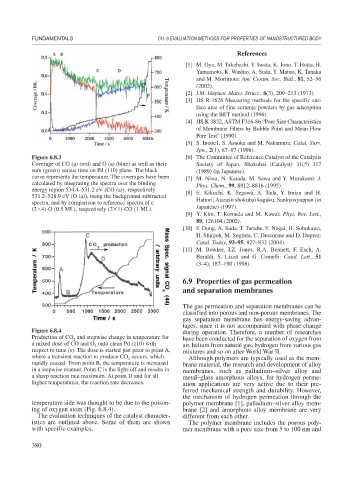
Figure 6.8.3 [6] The Committee of Reference Catalyst of the Catalysis
Coverage of CO (a) (red) and O (a) (blue) as well as their Society of Japan, Shokubai (Catalyst) 31(5) 317
sum (green) versus time on Pd (110) plane. The black (1989) (in Japanese).
curve represents the temperature. The coverages have been [7] M. Niwa, N. Katada, M. Sawa and Y. Murakami: J.
calculated by integrating the spectra over the binding Phys. Chem., 99, 8812–8816 (1995).
energy region 534.4–531.2 eV (CO (a)), respectively [8] E. Kikuchi, K. Segawa, A. Tada, Y. Imizu and H.
531.2–528.9 eV (O (a)), using the background subtracted
spectra, and by comparison to reference spectra of c Hattori: Atarasii shokubai kagaku, Sankyosyuppan (in
(2 4)-O (0.5 ML), respectively (2 1)-CO (1 ML). Japanese) (1997).
[9] Y. Kim, T. Komeda and M. Kawai: Phys. Rev. Lett.,
89, 126104 (2002).
[10] F. Dong, A. Suda, T. Tanabe, Y. Nagai, H. Sobukawa,
H. Shinjoh, M. Sugiura, C. Descorme and D. Duprez:
Catal. Today, 93–95, 827–832 (2004).
[11] M. Bowker, I.Z. Jones, R.A. Bennett, F. Esch, A.
Baraldi, S. Lizzit and G. Comelli: Catal. Lett., 51
(3–4), 187–190 (1998).
6.9 Properties of gas permeation
and separation membranes
The gas permeation and separation membranes can be
classified into porous and non-porous membranes. The
gas separation membrane has energy-saving advan-
tages, since it is not accompanied with phase change
Figure 6.8.4 during operation. Therefore, a number of researches
Production of CO and stepwise change in temperature for
2 have been conducted for the separation of oxygen from
a mixed dose of CO and O onto clean Pd (110) with
2 air, helium from natural gas, hydrogen from various gas
respect to time (s). The dose is started just prior to point A, mixtures and so on after World War II.
where a transient reaction to produce CO occurs, which
2 Although polymers are typically used as the mem-
rapidly ceased. From point B, the temperature is increased brane material, the research and development of alloy
in a stepwise manner. Point C is the light-off and results in membranes, such as palladium–silver alloy and
a sharp reaction rate maximum. At point D and for all metal–glass amorphous alloys, for hydrogen perme-
higher temperatures, the reaction rate decreases. ation applications are very active due to their pre-
ferred mechanical strength and durability. However,
the mechanism of hydrogen permeation through the
temperature side was thought to be due to the poison- polymer membrane [1], palladium–silver alloy mem-
ing of oxygen atom (Fig. 6.8.4). brane [2] and amorphous alloy membrane are very
The evaluation techniques of the catalyst character- different from each other.
istics are outlined above. Some of them are shown The polymer membrane includes the porous poly-
with specific examples. mer membrane with a pore size from 5 to 100 nm and
380