
Page 444 - Numerical Methods for Chemical Engineering
P. 444
Problems 433
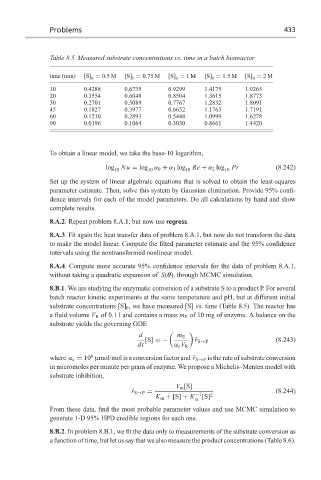
Table 8.5 Measured substrate concentrations vs. time in a batch bioreactor
time (min) [S] = 0.5 M [S] = 0.75 M [S] = 1 M [S] = 1.5 M [S] = 2M
0 0 0 0 0
10 0.4288 0.6735 0.9299 1.4175 1.9265
20 0.3554 0.6048 0.8504 1.3615 1.8773
30 0.2701 0.5089 0.7767 1.2832 1.8091
45 0.1827 0.3977 0.6652 1.1763 1.7191
60 0.1210 0.2893 0.5448 1.0999 1.6278
90 0.0196 0.1064 0.3030 0.8661 1.4420
To obtain a linear model, we take the base-10 logarithm,
log Nu = log α 0 + α 1 log Re + α 2 log 10 Pr (8.242)
10
10
10
Set up the system of linear algebraic equations that is solved to obtain the least-squares
parameter estimate. Then, solve this system by Gaussian elimination. Provide 95% confi-
dence intervals for each of the model parameters. Do all calculations by hand and show
complete results.
8.A.2. Repeat problem 8.A.1, but now use regress.
8.A.3. Fit again the heat transfer data of problem 8.A.1, but now do not transform the data
to make the model linear. Compute the fitted parameter estimate and the 95% confidence
intervals using the nontransformed nonlinear model.
8.A.4. Compute more accurate 95% confidence intervals for the data of problem 8.A.1,
without taking a quadratic expansion of S(θ), through MCMC simulation.
8.B.1. We are studying the enzymatic conversion of a substrate S to a product P. For several
batch reactor kinetic experiments at the same temperature and pH, but at different initial
substrate concentrations [S] 0 , we have measured [S] vs. time (Table 8.5). The reactor has
a fluid volume V R of 0.1 l and contains a mass m E of 10 mg of enzyme. A balance on the
substrate yields the governing ODE
d m E
[S] =− ˆ r S→P (8.243)
dt α c V R
6
where α c = 10 µmol/mol is a conversion factor and ˆ r S→P is the rate of substrate conversion
in micromoles per minute per gram of enzyme. We propose a Michelis–Menten model with
substrate inhibition,
V m [S]
ˆ r S→P = −1 (8.244)
K m + [S] + K [S] 2
si
From these data, find the most probable parameter values and use MCMC simulation to
generate 1-D 95% HPD credible regions for each one.
8.B.2. In problem 8.B.1, we fit the data only to measurements of the substrate conversion as
a function of time, but let us say that we also measure the product concentrations (Table 8.6).