
Page 445 - Numerical Methods for Chemical Engineering
P. 445
434 8 Bayesian statistics and parameter estimation
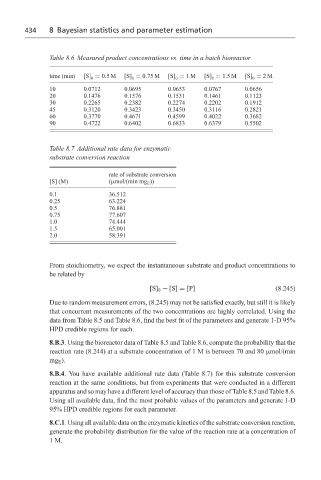
Table 8.6 Measured product concentrations vs. time in a batch bioreactor
time (min) [S] = 0.5 M [S] = 0.75 M [S] = 1 M [S] = 1.5 M [S] = 2M
0 0 0 0 0
10 0.0712 0.0695 0.0653 0.0767 0.0656
20 0.1476 0.1576 0.1531 0.1461 0.1123
30 0.2265 0.2382 0.2274 0.2202 0.1912
45 0.3120 0.3423 0.3450 0.3116 0.2821
60 0.3770 0.4671 0.4599 0.4022 0.3682
90 0.4722 0.6402 0.6833 0.6379 0.5502
Table 8.7 Additional rate data for enzymatic
substrate conversion reaction
rate of substrate conversion
[S] (M) (µmol/(min mg E ))
0.1 36.512
0.25 63.224
0.5 76.881
0.75 77.607
1.0 74.444
1.5 65.001
2.0 58.391
From stoichiometry, we expect the instantaneous substrate and product concentrations to
be related by
[S] 0 − [S] = [P] (8.245)
Due to random measurement errors, (8.245) may not be satisfied exactly, but still it is likely
that concurrent measurements of the two concentrations are highly correlated. Using the
data from Table 8.5 and Table 8.6, find the best fit of the parameters and generate 1-D 95%
HPD credible regions for each.
8.B.3. Using the bioreactor data of Table 8.5 and Table 8.6, compute the probability that the
reaction rate (8.244) at a substrate concentration of 1 M is between 70 and 80 µmol/(min
mg E ).
8.B.4. You have available additional rate data (Table 8.7) for this substrate conversion
reaction at the same conditions, but from experiments that were conducted in a different
apparatus and so may have a different level of accuracy than those of Table 8.5 and Table 8.6.
Using all available data, find the most probable values of the parameters and generate 1-D
95% HPD credible regions for each parameter.
8.C.1. Using all available data on the enzymatic kinetics of the substrate conversion reaction,
generate the probability distribution for the value of the reaction rate at a concentration of
1M.