
Page 458 - Numerical Methods for Chemical Engineering
P. 458
Convolution and correlation 447
2
t
2
1 1 2
t
1
w a
2w a w i w a
w i w a
w
2
1 1 2 2
w
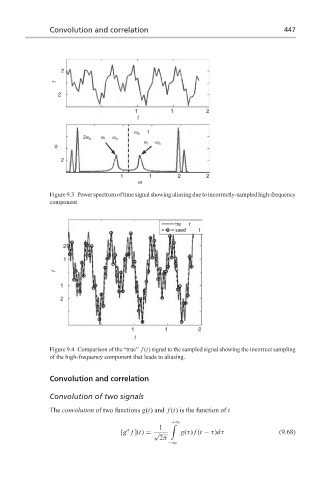
Figure 9.3 Power spectrum of time signal showing aliasing due to incorrectly-sampled high-frequency
component.
tre t
saed t
2
1
t
1
2
1 1 2
t
Figure 9.4 Comparison of the “true” f (t) signal to the sampled signal showing the incorrect sampling
of the high-frequency component that leads to aliasing.
Convolution and correlation
Convolution of two signals
The convolution of two functions g(t) and f (t) is the function of t
+∞
'
1
∗
[g f ](t) = √ g(τ) f (t − τ)dτ (9.68)
2π
−∞