
Page 82 - Offshore Electrical Engineering Manual
P. 82
Breaking Current 69
8
7
Line current (pu), 1pu = 717 amps 5 Ceiling current
6
4
with AVR
3
2
1 Steady state current Without AVR
0
0 .25 .5 .75 .1 1.25 1.5 1.75 2 2.25 2.5 2.75
Time (s)
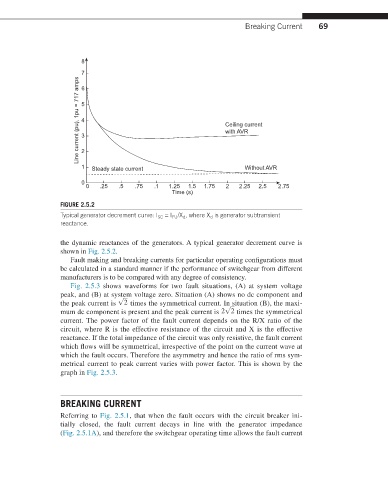
FIGURE 2.5.2
Typical generator decrement curve: I SC = I FU /X d , where X d is generator subtransient
reactance.
the dynamic reactances of the generators. A typical generator decrement curve is
shown in Fig. 2.5.2.
Fault making and breaking currents for particular operating configurations must
be calculated in a standard manner if the performance of switchgear from different
manufacturers is to be compared with any degree of consistency.
Fig. 2.5.3 shows waveforms for two fault situations, (A) at system voltage
peak, and (B) at system voltage zero. Situation (A) shows no dc component and
√
the peak current is 2 times the symmetrical current. In situation (B), the maxi-
√
mum dc component is present and the peak current is 2 2 times the symmetrical
current. The power factor of the fault current depends on the R/X ratio of the
circuit, where R is the effective resistance of the circuit and X is the effective
reactance. If the total impedance of the circuit was only resistive, the fault current
which flows will be symmetrical, irrespective of the point on the current wave at
which the fault occurs. Therefore the asymmetry and hence the ratio of rms sym-
metrical current to peak current varies with power factor. This is shown by the
graph in Fig. 2.5.3.
BREAKING CURRENT
Referring to Fig. 2.5.1, that when the fault occurs with the circuit breaker ini-
tially closed, the fault current decays in line with the generator impedance
(Fig. 2.5.1A), and therefore the switchgear operating time allows the fault current