
Page 168 - Organic Electronics in Sensors and Biotechnology
P. 168
Integrated Pyr oelectric Sensors 145
Current response Voltage response
1 μm 2 1 μm 2
10 μm 2 10 μm 2
10 –6 1000 μm 2 10 0 1000 μm 2
1 mm 2 1 mm 2
10 –8 1 cm 2 10 –2 1 cm 2
10 cm 2
Current (A) 10 –10 100 cm 2 Voltage (V) 10 –4 100 cm 2
10 cm 2
10 –6
10 –12
10 –14 10 –8
10 –16 10 –10
10 –4 10 –2 10 0 10 2 10 4 10 6 10 –4 10 –2 10 0 10 2 10 4 10 6
Frequency (Hz) Frequency (Hz)
(a) (b)
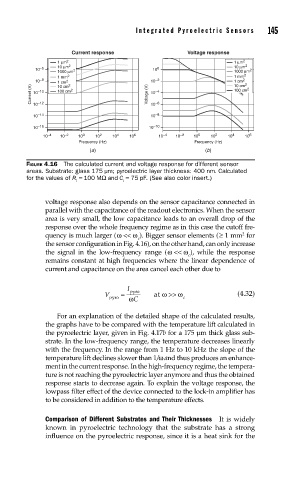
FIGURE 4.16 The calculated current and voltage response for different sensor
areas. Substrate: glass 175 μm; pyroelectric layer thickness: 400 nm. Calculated
for the values of R = 100 MΩ and C = 75 pF. (See also color insert.)
i i
voltage response also depends on the sensor capacitance connected in
parallel with the capacitance of the readout electronics. When the sensor
area is very small, the low capacitance leads to an overall drop of the
response over the whole frequency regime as in this case the cutoff fre-
quency is much larger (ω << ω ). Bigger sensor elements ( ≥ 1 mm for
2
c
the sensor configuration in Fig. 4.16), on the other hand, can only increase
the signal in the low-frequency range (ω << ω ), while the response
c
remains constant at high frequencies where the linear dependence of
current and capacitance on the area cancel each other due to
I
V = pyro at ω >> ω (4.32)
pyro ω C c
For an explanation of the detailed shape of the calculated results,
the graphs have to be compared with the temperature lift calculated in
the pyroelectric layer, given in Fig. 4.17b for a 175 μm thick glass sub-
strate. In the low-frequency range, the temperature decreases linearly
with the frequency. In the range from 1 Hz to 10 kHz the slope of the
temperature lift declines slower than 1/ω and thus produces an enhance-
ment in the current response. In the high-frequency regime, the tempera-
ture is not reaching the pyroelectric layer anymore and thus the obtained
response starts to decrease again. To explain the voltage response, the
lowpass filter effect of the device connected to the lock-in amplifier has
to be considered in addition to the temperature effects.
Comparison of Different Substrates and Their Thicknesses It is widely
known in pyroelectric technology that the substrate has a strong
influence on the pyroelectric response, since it is a heat sink for the