
Page 347 - Organic Electronics in Sensors and Biotechnology
P. 347
324 Cha pte r Ei g h t
2.5
V g (V)
60
2.0
100
I ph (arb. unit) 40 1.5 α (10 5 cm –1 )
20
1.0
50
0
0.5
0 0
400 500 600 700
λ (nm)
(a)
250 4
Resp. (A/W) 2 2.0
200
V g (V) 0 450 650 1.5
l ph (arb. unit) 150 40 λ (nm) 1.0 α (10 5 cm –1 )
100
80
60
20
100
50 0 0.5
0 0
400 500 600 700
λ (nm)
(b)
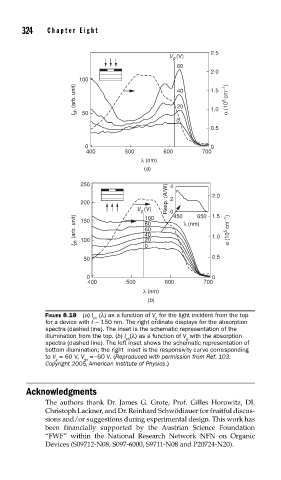
FIGURE 8.18 (a) I (λ) as a function of V for the light incident from the top
ph g
for a device with t ~ 150 nm. The right ordinate displays for the absorption
spectra (dashed line). The inset is the schematic representation of the
illumination from the top. (b) I (λ) as a function of V with the absorption
ph
g
spectra (dashed line). The left inset shows the schematic representation of
bottom illumination; the right inset is the responsivity curve corresponding
to V = 60 V, V =−60 V. (Reproduced with permission from Ref. 103.
g ds
Copyright 2005, American Institute of Physics.)
Acknowledgments
The authors thank Dr. James G. Grote, Prof. Gilles Horowitz, DI.
Christoph Lackner, and Dr. Reinhard Schwödiauer for fruitful discus-
sions and/or suggestions during experimental design. This work has
been financially supported by the Austrian Science Foundation
‘‘FWF’’ within the National Research Network NFN on Organic
Devices (S09712-N08, S097-6000, S9711-N08 and P20724-N20).