
Page 300 - Orlicky's Material Requirements Planning
P. 300
CHAPTER 15 Industry Effect on MRP 279
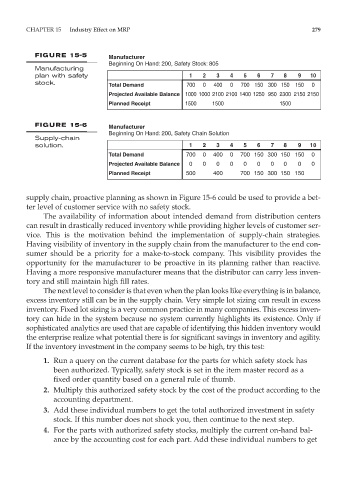
FIGURE 15-5 Manufacturer
Beginning On Hand: 200, Safety Stock: 805
Manufacturing
plan with safety 1 2 3 4 5 6 7 8 9 10
stock. Total Demand 700 0 400 0 700 150 300 150 150 0
Projected Available Balance 1000 1000 2100 2100 1400 1250 950 2300 2150 2150
Planned Receipt 1500 1500 1500
FIGURE 15-6 Manufacturer
Beginning On Hand: 200, Safety Chain Solution
Supply-chain
solution. 1 2 3 4 5 6 7 8 9 10
Total Demand 700 0 400 0 700 150 300 150 150 0
Projected Available Balance 0 0 0 0 0 0 0 0 0 0
Planned Receipt 500 400 700 150 300 150 150
supply chain, proactive planning as shown in Figure 15-6 could be used to provide a bet-
ter level of customer service with no safety stock.
The availability of information about intended demand from distribution centers
can result in drastically reduced inventory while providing higher levels of customer ser-
vice. This is the motivation behind the implementation of supply-chain strategies.
Having visibility of inventory in the supply chain from the manufacturer to the end con-
sumer should be a priority for a make-to-stock company. This visibility provides the
opportunity for the manufacturer to be proactive in its planning rather than reactive.
Having a more responsive manufacturer means that the distributor can carry less inven-
tory and still maintain high fill rates.
The next level to consider is that even when the plan looks like everything is in balance,
excess inventory still can be in the supply chain. Very simple lot sizing can result in excess
inventory. Fixed lot sizing is a very common practice in many companies. This excess inven-
tory can hide in the system because no system currently highlights its existence. Only if
sophisticated analytics are used that are capable of identifying this hidden inventory would
the enterprise realize what potential there is for significant savings in inventory and agility.
If the inventory investment in the company seems to be high, try this test:
1. Run a query on the current database for the parts for which safety stock has
been authorized. Typically, safety stock is set in the item master record as a
fixed order quantity based on a general rule of thumb.
2. Multiply this authorized safety stock by the cost of the product according to the
accounting department.
3. Add these individual numbers to get the total authorized investment in safety
stock. If this number does not shock you, then continue to the next step.
4. For the parts with authorized safety stocks, multiply the current on-hand bal-
ance by the accounting cost for each part. Add these individual numbers to get