
Page 299 - Orlicky's Material Requirements Planning
P. 299
278 PART 3 Managing with the MRP System
the manufacturer can build more closely to actual consumption in the supply chain. This
approach was introduced in Chapter 2. The benefit for the manufacturer is that the fore-
casts are more accurate, and production resources are allocated to items that will really
sell without a major reduction in price.
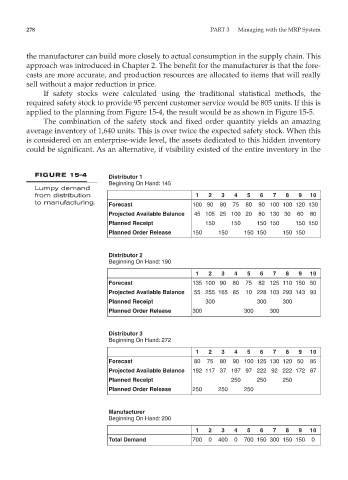
If safety stocks were calculated using the traditional statistical methods, the
required safety stock to provide 95 percent customer service would be 805 units. If this is
applied to the planning from Figure 15-4, the result would be as shown in Figure 15-5.
The combination of the safety stock and fixed order quantity yields an amazing
average inventory of 1,640 units. This is over twice the expected safety stock. When this
is considered on an enterprise-wide level, the assets dedicated to this hidden inventory
could be significant. As an alternative, if visibility existed of the entire inventory in the
FIGURE 15-4 Distributor 1
Beginning On Hand: 145
Lumpy demand
from distribution 1 2 3 4 5 6 7 8 9 10
to manufacturing. Forecast 100 90 80 75 80 90 100 100 120 130
Projected Available Balance 45 105 25 100 20 80 130 30 60 80
Planned Receipt 150 150 150 150 150 150
Planned Order Release 150 150 150 150 150 150
Distributor 2
Beginning On Hand: 190
1 2 3 4 5 6 7 8 9 10
Forecast 135 100 90 80 75 82 125 110 150 50
Projected Available Balance 55 255 165 85 10 228 103 293 143 93
Planned Receipt 300 300 300
Planned Order Release 300 300 300
Distributor 3
Beginning On Hand: 272
1 2 3 4 5 6 7 8 9 10
Forecast 80 75 80 90 100 125 130 120 50 85
Projected Available Balance 192 117 37 197 97 222 92 222 172 87
Planned Receipt 250 250 250
Planned Order Release 250 250 250
Manufacturer
Beginning On Hand: 200
1 2 3 4 5 6 7 8 9 10
Total Demand 700 0 400 0 700 150 300 150 150 0