
Page 343 - Orlicky's Material Requirements Planning
P. 343
322 PART 3 Managing with the MRP System
FIGURE 19-3 450,000
400,000
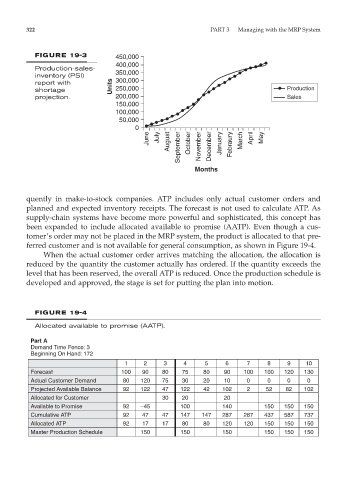
Production-sales-
inventory (PSI) 350,000
report with Units 300,000
shortage 250,000 Production
projection. 200,000 Sales
150,000
100,000
50,000
0
June July August September October November December January Febraury March April May
Months
quently in make-to-stock companies. ATP includes only actual customer orders and
planned and expected inventory receipts. The forecast is not used to calculate ATP. As
supply-chain systems have become more powerful and sophisticated, this concept has
been expanded to include allocated available to promise (AATP). Even though a cus-
tomer’s order may not be placed in the MRP system, the product is allocated to that pre-
ferred customer and is not available for general consumption, as shown in Figure 19-4.
When the actual customer order arrives matching the allocation, the allocation is
reduced by the quantity the customer actually has ordered. If the quantity exceeds the
level that has been reserved, the overall ATP is reduced. Once the production schedule is
developed and approved, the stage is set for putting the plan into motion.
FIGURE 19-4
Allocated available to promise (AATP).
Part A
Demand Time Fence: 3
Beginning On Hand: 172
1 2 3 4 5 6 7 8 9 10
Forecast 100 90 80 75 80 90 100 100 120 130
Actual Customer Demand 80 120 75 30 20 10 0 0 0 0
Projected Available Balance 92 122 47 122 42 102 2 52 82 102
Allocated for Customer 30 20 20
Available to Promise 92 –45 100 140 150 150 150
Cumulative ATP 92 47 47 147 147 287 287 437 587 737
Allocated ATP 92 17 17 80 80 120 120 150 150 150
Master Production Schedule 150 150 150 150 150 150