
Page 341 - Orlicky's Material Requirements Planning
P. 341
320 PART 3 Managing with the MRP System
that is usually followed is to maximize production on first shift before adding addition-
al shifts.
No work orders are created to track these requirements. A true repetitive system will
have the function to input the expected schedule in a way very similar to the preceding
chart. This makes schedule changes and “what if” analysis much simpler to accomplish.
PRODUCTION-SALES-INVENTORY ANALYSIS
In a repetitive manufacturing company, the product usually is built to stock. Customers
expect their orders to be fulfilled very quickly from a finite number of possible configu-
rations. Forecasting is used to project future demand so that production rates can be
scheduled. The production rate is compared with the projected sales rate to determine the
impact on inventory. If the production rate exceeds the sales rate, then inventory will rise.
If the sales rate exceeds the production rate, inventory will fall. Inventory can consume
significant cash and physical space in the enterprise. These resources should be planned
in advance to ensure that sufficient capacity exists to support the overall plan rather than
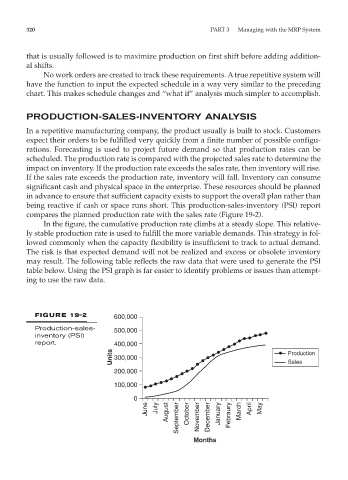
being reactive if cash or space runs short. This production-sales-inventory (PSI) report
compares the planned production rate with the sales rate (Figure 19-2).
In the figure, the cumulative production rate climbs at a steady slope. This relative-
ly stable production rate is used to fulfill the more variable demands. This strategy is fol-
lowed commonly when the capacity flexibility is insufficient to track to actual demand.
The risk is that expected demand will not be realized and excess or obsolete inventory
may result. The following table reflects the raw data that were used to generate the PSI
table below. Using the PSI graph is far easier to identify problems or issues than attempt-
ing to use the raw data.
FIGURE 19-2 600,000
Production-sales- 500,000
inventory (PSI)
report. 400,000
Units 300,000 Production
Sales
200,000
100,000
0
June July August September October November December January Febraury March April May
Months