
Page 417 - Orlicky's Material Requirements Planning
P. 417
396 PART 4 Looking Backward and Forward
ASRLT AND MATRIX BOMS
Leveraging the previous concept of ASRLT in combination with other tools can give
unprecedented visibility across a company’s various BOMs in order to identify where to
stock and where not to stock. Many manufacturers make many types of end items.
Despite each end item having a unique BOM, frequently there is a substantial number of
shared components across these end-item BOMs.
In these scenarios (significant number of shared components across BOMs), using a
matrix BOM in combination with ASRLT becomes a powerful inventory leverage and
lead-time compression tool. A matrix BOM is “a chart made up from the bills of material
for a number of products in the same or similar families. It is arranged in a matrix with
components in columns and parents in rows (or vice versa) so that requirements for com-
mon components can be summarized conveniently.” 1
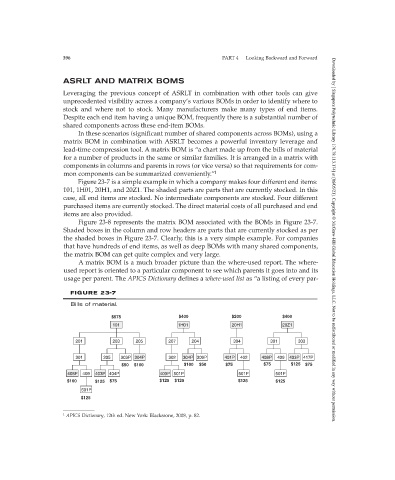
Figure 23-7 is a simple example in which a company makes four different end items:
101, 1H01, 20H1, and 20Z1. The shaded parts are parts that are currently stocked. In this
case, all end items are stocked. No intermediate components are stocked. Four different
purchased items are currently stocked. The direct material costs of all purchased and end
items are also provided.
Figure 23-8 represents the matrix BOM associated with the BOMs in Figure 23-7.
Shaded boxes in the column and row headers are parts that are currently stocked as per
the shaded boxes in Figure 23-7. Clearly, this is a very simple example. For companies Downloaded by [ Singapore Polytechnic Library 176.79.113.174] at [06/05/21]. Copyright © McGraw-Hill Global Education Holdings, LLC. Not to be redistributed or modified in any way without permission.
that have hundreds of end items, as well as deep BOMs with many shared components,
the matrix BOM can get quite complex and very large.
A matrix BOM is a much broader picture than the where-used report. The where-
used report is oriented to a particular component to see which parents it goes into and its
usage per parent. The APICS Dictionary defines a where-used list as “a listing of every par-
FIGURE 23-7
Bills of material.
$575 $400 $200 $400
101 1H01 20H1 20Z1
201 203 205 207 204 304 301 303
301 305 303P 304P 302 304P 309P 401P 402 408P 409 403P 417P
$50 $100 $100 $50 $75 $75 $125 $75
408P 409 403P 404P 403P 501P 501P 501P
$100 $125 $75 $125 $125 $125 $125
501P
$125
1 APICS Dictionary, 12th ed. New York: Blackstone, 2008, p. 82.