
Page 71 - PVT Property Correlations
P. 71
Dry Gases Chapter | 3 49
TABLE 3.14 Elsharkawy (2000) Constants
i a b
0 20.040279933 20.776423332
1 0.881709332 1.030721752
2 0.800591625 0.734009058
3 1.037850321 0.909963446
4 1.059063178 0.888959152
TABLE 3.15 Results Comparison
Sutton Elsharkawy Kay’s Rules
T c (R) 631.4 408.6 422.8
P c (psia) 741.4 645.5 644.8
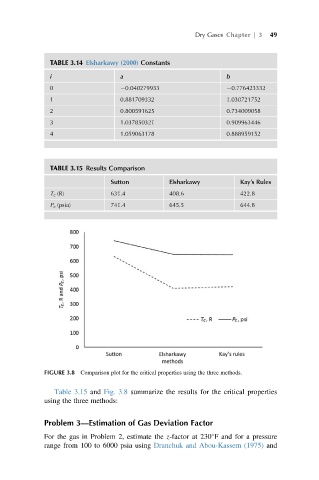
FIGURE 3.8 Comparison plot for the critical properties using the three methods.
Table 3.15 and Fig. 3.8 summarize the results for the critical properties
using the three methods:
Problem 3—Estimation of Gas Deviation Factor
For the gas in Problem 2, estimate the z-factor at 230 F and for a pressure
range from 100 to 6000 psia using Dranchuk and Abou-Kassem (1975) and