
Page 73 - PVT Property Correlations
P. 73
Dry Gases Chapter | 3 51
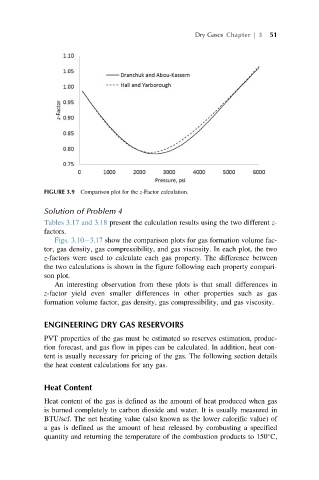
FIGURE 3.9 Comparison plot for the z-Factor calculation.
Solution of Problem 4
Tables 3.17 and 3.18 present the calculation results using the two different z-
factors.
Figs. 3.10 3.17 show the comparison plots for gas formation volume fac-
tor, gas density, gas compressibility, and gas viscosity. In each plot, the two
z-factors were used to calculate each gas property. The difference between
the two calculations is shown in the figure following each property compari-
son plot.
An interesting observation from these plots is that small differences in
z-factor yield even smaller differences in other properties such as gas
formation volume factor, gas density, gas compressibility, and gas viscosity.
ENGINEERING DRY GAS RESERVOIRS
PVT properties of the gas must be estimated so reserves estimation, produc-
tion forecast, and gas flow in pipes can be calculated. In addition, heat con-
tent is usually necessary for pricing of the gas. The following section details
the heat content calculations for any gas.
Heat Content
Heat content of the gas is defined as the amount of heat produced when gas
is burned completely to carbon dioxide and water. It is usually measured in
BTU/scf. The net heating value (also known as the lower calorific value) of
a gas is defined as the amount of heat released by combusting a specified
quantity and returning the temperature of the combustion products to 150 C,