
Page 72 - PVT Property Correlations
P. 72
50 PVT Property Correlations
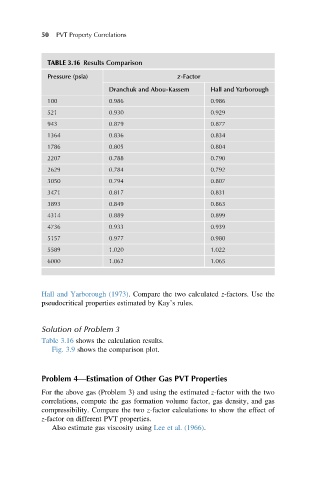
TABLE 3.16 Results Comparison
Pressure (psia) z-Factor
Dranchuk and Abou-Kassem Hall and Yarborough
100 0.986 0.986
521 0.930 0.929
943 0.879 0.877
1364 0.836 0.834
1786 0.805 0.804
2207 0.788 0.790
2629 0.784 0.792
3050 0.794 0.807
3471 0.817 0.831
3893 0.849 0.863
4314 0.889 0.899
4736 0.933 0.939
5157 0.977 0.980
5589 1.020 1.022
6000 1.062 1.065
Hall and Yarborough (1973). Compare the two calculated z-factors. Use the
pseudocritical properties estimated by Kay’s rules.
Solution of Problem 3
Table 3.16 shows the calculation results.
Fig. 3.9 shows the comparison plot.
Problem 4—Estimation of Other Gas PVT Properties
For the above gas (Problem 3) and using the estimated z-factor with the two
correlations, compute the gas formation volume factor, gas density, and gas
compressibility. Compare the two z-factor calculations to show the effect of
z-factor on different PVT properties.
Also estimate gas viscosity using Lee et al. (1966).