
Page 171 - Partition & Adsorption of Organic Contaminants in Environmental Systems
P. 171
162 CONTAMINANT SORPTION TO SOILS AND NATURAL SOLIDS
80
Humin
Uptake by Sorbent, Q (mg/g) 40 0 0 0.03
Whole peat
3
60
20
0
0 0.2 0.4 0.6
Relative Concentration, C /S
e w
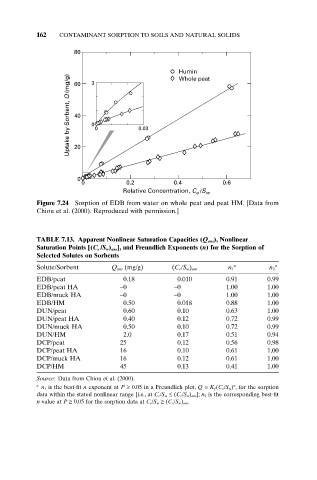
Figure 7.24 Sorption of EDB from water on whole peat and peat HM. [Data from
Chiou et al. (2000). Reproduced with permission.]
TABLE 7.13. Apparent Nonlinear Saturation Capacities (Q ans), Nonlinear
Saturation Points [(C e /S w) ans], and Freundlich Exponents (n) for the Sorption of
Selected Solutes on Sorbents
Solute/Sorbent Q ans (mg/g) (C e/S w) ans n 1 a n 2 a
EDB/peat 0.18 0.010 0.91 0.99
EDB/peat HA ~0 ~0 1.00 1.00
EDB/muck HA ~0 ~0 1.00 1.00
EDB/HM 0.50 0.018 0.88 1.00
DUN/peat 0.60 0.10 0.63 1.00
DUN/peat HA 0.40 0.12 0.72 0.99
DUN/muck HA 0.50 0.10 0.72 0.99
DUN/HM 2.0 0.17 0.51 0.94
DCP/peat 25 0.12 0.56 0.98
DCP/peat HA 16 0.10 0.61 1.00
DCP/muck HA 16 0.12 0.61 1.00
DCP/HM 45 0.13 0.41 1.00
Source: Data from Chiou et al. (2000).
n
a n 1 is the best-fit n exponent at P ≥ 0.05 in a Freundlich plot, Q = K f (C e/S w) , for the sorption
data within the stated nonlinear range [i.e., at C e/S w £ (C e/S w) ans]; n 2 is the corresponding best-fit
n value at P ≥ 0.05 for the sorption data at C e/S w ≥ (C e/S w) ans.