
Page 172 - Partition & Adsorption of Organic Contaminants in Environmental Systems
P. 172
SORPTION FROM WATER SOLUTION 163
8
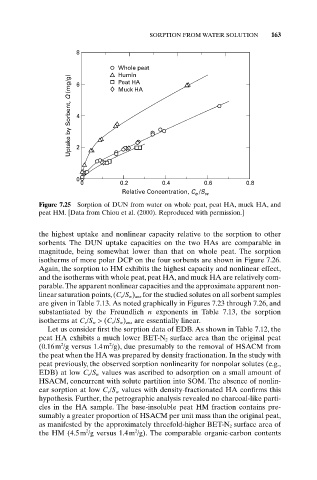
Whole peat
Humin
Uptake by Sorbent, Q (mg/g) 4 2
Peat HA
6
Muck HA
0
0 0.2 0.4 0.6 0.8
Relative Concentration, C /S w
e
Figure 7.25 Sorption of DUN from water on whole peat, peat HA, muck HA, and
peat HM. [Data from Chiou et al. (2000). Reproduced with permission.]
the highest uptake and nonlinear capacity relative to the sorption to other
sorbents. The DUN uptake capacities on the two HAs are comparable in
magnitude, being somewhat lower than that on whole peat. The sorption
isotherms of more polar DCP on the four sorbents are shown in Figure 7.26.
Again, the sorption to HM exhibits the highest capacity and nonlinear effect,
and the isotherms with whole peat, peat HA, and muck HA are relatively com-
parable.The apparent nonlinear capacities and the approximate apparent non-
linear saturation points, (C e/S w) ans for the studied solutes on all sorbent samples
are given in Table 7.13. As noted graphically in Figures 7.23 through 7.26, and
substantiated by the Freundlich n exponents in Table 7.13, the sorption
isotherms at C e/S w > (C e/S w) ans are essentially linear.
Let us consider first the sorption data of EDB. As shown in Table 7.12, the
peat HA exhibits a much lower BET-N 2 surface area than the original peat
2
2
(0.16m /g versus 1.4m /g), due presumably to the removal of HSACM from
the peat when the HA was prepared by density fractionation. In the study with
peat previously, the observed sorption nonlinearity for nonpolar solutes (e.g.,
EDB) at low C e /S w values was ascribed to adsorption on a small amount of
HSACM, concurrent with solute partition into SOM. The absence of nonlin-
ear sorption at low C e /S w values with density-fractionated HA confirms this
hypothesis. Further, the petrographic analysis revealed no charcoal-like parti-
cles in the HA sample. The base-insoluble peat HM fraction contains pre-
sumably a greater proportion of HSACM per unit mass than the original peat,
as manifested by the approximately threefold-higher BET-N 2 surface area of
2
2
the HM (4.5m /g versus 1.4m /g). The comparable organic-carbon contents