
Page 206 - Partition & Adsorption of Organic Contaminants in Environmental Systems
P. 206
SORPTION FROM ORGANIC SOLVENTS 197
5000
(a) -80 (b)
Uptake of Parathion by Soil, Q (µg/g) 3000 Oven-dried, 20°C H ads (kJ/mol) -40 0 3000 h Q (µg/g) 5000
4000
– H
Oven-dried, 30°C
Air-dried, 20°C
4000
2000
Air-dried, 30°C
1000
0
0 200 400 600
Equilibrium Concentration, C (mg/L)
e
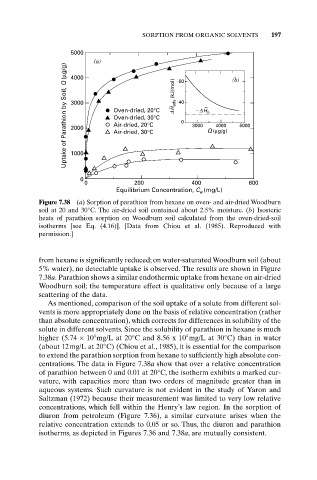
Figure 7.38 (a) Sorption of parathion from hexane on oven- and air-dried Woodburn
soil at 20 and 30°C. The air-dried soil contained about 2.5% moisture. (b) Isosteric
heats of parathion sorption on Woodburn soil calculated from the oven-dried-soil
isotherms [see Eq. (4.16)]. [Data from Chiou et al. (1985). Reproduced with
permission.]
from hexane is significantly reduced; on water-saturated Woodburn soil (about
5% water), no detectable uptake is observed. The results are shown in Figure
7.38a. Parathion shows a similar endothermic uptake from hexane on air-dried
Woodburn soil; the temperature effect is qualitative only because of a large
scattering of the data.
As mentioned, comparison of the soil uptake of a solute from different sol-
vents is more appropriately done on the basis of relative concentration (rather
than absolute concentration), which corrects for differences in solubility of the
solute in different solvents. Since the solubility of parathion in hexane is much
4
4
higher (5.74 ¥ 10 mg/L at 20°C and 8.56 x 10 mg/L at 30°C) than in water
(about 12mg/L at 20°C) (Chiou et al., 1985), it is essential for the comparison
to extend the parathion sorption from hexane to sufficiently high absolute con-
centrations. The data in Figure 7.38a show that over a relative concentration
of parathion between 0 and 0.01 at 20°C, the isotherm exhibits a marked cur-
vature, with capacities more than two orders of magnitude greater than in
aqueous systems. Such curvature is not evident in the study of Yaron and
Saltzman (1972) because their measurement was limited to very low relative
concentrations, which fell within the Henry’s law region. In the sorption of
diuron from petroleum (Figure 7.36), a similar curvature arises when the
relative concentration extends to 0.05 or so. Thus, the diuron and parathion
isotherms, as depicted in Figures 7.36 and 7.38a, are mutually consistent.