
Page 140 - Phase Space Optics Fundamentals and Applications
P. 140
The Radon-Wigner Transform 121
0.50 6.00
5.00
Focal length (m) 0.40 4.00 Power (D)
0.30
3.00
0.20
0.10 2.00
1.00
0.00 0.00
0.00 0.20 0.40 0.60 0.80 1.00
p
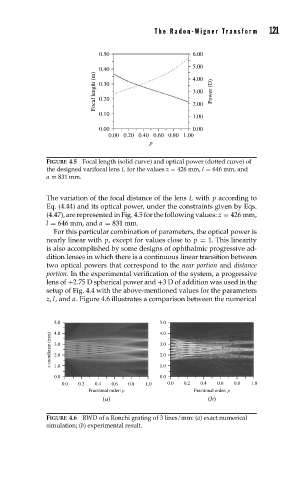
FIGURE 4.5 Focal length (solid curve) and optical power (dotted curve) of
the designed varifocal lens L for the values z = 426 mm, l = 646 mm, and
a = 831 mm.
The variation of the focal distance of the lens L with p according to
Eq. (4.44) and its optical power, under the constraints given by Eqs.
(4.47), are represented in Fig. 4.5 for the following values: z = 426 mm,
l = 646 mm, and a = 831 mm.
For this particular combination of parameters, the optical power is
nearly linear with p, except for values close to p = 1. This linearity
is also accomplished by some designs of ophthalmic progressive ad-
dition lenses in which there is a continuous linear transition between
two optical powers that correspond to the near portion and distance
portion. In the experimental verification of the system, a progressive
lens of +2.75 D spherical power and +3 D of addition was used in the
setup of Fig. 4.4 with the above-mentioned values for the parameters
z, l, and a. Figure 4.6 illustrates a comparison between the numerical
5.0 5.0
4.0
4.0
x coordinate (mm) 3.0 3.0
2.0
2.0
1.0
0.0
0.0 1.0
0.0 0.2 0.4 0.6 0.8 1.0 0.0 0.2 0.4 0.6 0.8 1.0
Fractional order: p Fractional order: p
(a) (b)
FIGURE 4.6 RWD of a Ronchi grating of 3 lines/mm: (a) exact numerical
simulation; (b) experimental result.