
Page 345 - Phase Space Optics Fundamentals and Applications
P. 345
326 Chapter Ten
in Fig. 10.7a. Sampling this signal is modeled by multiplying by the
comb function defined in Eq. (10.12) to get a sampled function u T (x).
u T (x) = u(x) T (x) (10.25)
Employing the Fourier series of the comb function in Eq. (10.12), we
may deduce that the Fourier transform of u T (x) is given by an infinite
sum of shifted replicas of U(k)
∞
1 , n
U T (k) = U k − (10.26)
T T
n=−∞
k k
x x
b
(a) (b)
k
k
x x
(c) (d)
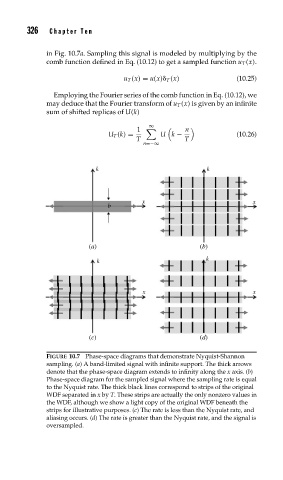
FIGURE 10.7 Phase-space diagrams that demonstrate Nyquist-Shannon
sampling. (a) A band-limited signal with infinite support. The thick arrows
denote that the phase-space diagram extends to infinity along the x axis. (b)
Phase-space diagram for the sampled signal where the sampling rate is equal
to the Nyquist rate. The thick black lines correspond to strips of the original
WDF separated in x by T. These strips are actually the only nonzero values in
the WDF, although we show a light copy of the original WDF beneath the
strips for illustrative purposes. (c) The rate is less than the Nyquist rate, and
aliasing occurs. (d) The rate is greater than the Nyquist rate, and the signal is
oversampled.