
Page 124 - Phase-Locked Loops Design, Simulation, and Applications
P. 124
MIXED-SIGNAL PLL ANALYSIS Ronald E. Best 80
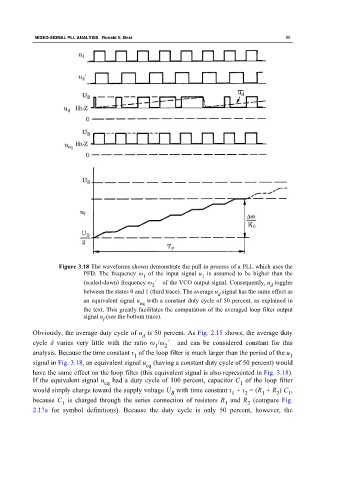
Figure 3.18 The waveforms shown demonstrate the pull-in process of a PLL which uses the
PFD. The frequency ω of the input signal u is assumed to be higher than the
1
1
(scaled-down) frequency ω ′ of the VCO output signal. Consequently, u toggles
d
2
between the states 0 and 1 (third trace). The average u signal has the same effect as
d
an equivalent signal u with a constant duty cycle of 50 percent, as explained in
eq
the text. This greatly facilitates the computation of the averaged loop filter output
signal u (see the bottom trace).
f
Obviously, the average duty cycle of u is 50 percent. As Fig. 2.15 shows, the average duty
d
cycle δ varies very little with the ratio ω /ω ′ and can be considered constant for this
1
2
analysis. Because the time constant τ of the loop filter is much larger than the period of the u
1 1
signal in Fig. 3.18, an equivalent signal u (having a constant duty cycle of 50 percent) would
eq
have the same effect on the loop filter (this equivalent signal is also represented in Fig. 3.18).
If the equivalent signal u had a duty cycle of 100 percent, capacitor C of the loop filter
eq 1
would simply charge toward the supply voltage U with time constant τ + τ = (R + R ) C ,
1
2
1
2
B
1
because C is charged through the series connection of resistors R and R (compare Fig.
1 1 2
2.17a for symbol definitions). Because the duty cycle is only 50 percent, however, the