
Page 103 - Photodetection and Measurement - Maximizing Performance in Optical Systems
P. 103
System Noise and Synchronous Detection
96 Chapter Five
Frequency translation
p
Output 1/2 RC Shifted RC low-pass
voltage response
RC low-pass
Image response
response
±1/2pRC
Slope: 20dB/decade
0Hz f mod Frequency
(log scale)
Signal
Signal + modulation
noise
power
Noise
0Hz f mod Frequency
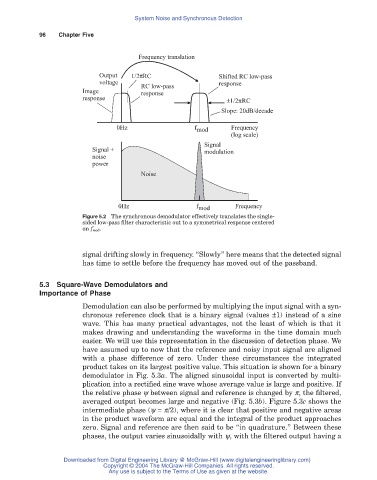
Figure 5.2 The synchronous demodulator effectively translates the single-
sided low-pass filter characteristic out to a symmetrical response centered
on f mod.
signal drifting slowly in frequency. “Slowly” here means that the detected signal
has time to settle before the frequency has moved out of the passband.
5.3 Square-Wave Demodulators and
Importance of Phase
Demodulation can also be performed by multiplying the input signal with a syn-
chronous reference clock that is a binary signal (values ±1) instead of a sine
wave. This has many practical advantages, not the least of which is that it
makes drawing and understanding the waveforms in the time domain much
easier. We will use this representation in the discussion of detection phase. We
have assumed up to now that the reference and noisy input signal are aligned
with a phase difference of zero. Under these circumstances the integrated
product takes on its largest positive value. This situation is shown for a binary
demodulator in Fig. 5.3a. The aligned sinusoidal input is converted by multi-
plication into a rectified sine wave whose average value is large and positive. If
the relative phase y between signal and reference is changed by p, the filtered,
averaged output becomes large and negative (Fig. 5.3b). Figure 5.3c shows the
intermediate phase (y = p/2), where it is clear that positive and negative areas
in the product waveform are equal and the integral of the product approaches
zero. Signal and reference are then said to be “in quadrature.” Between these
phases, the output varies sinusoidally with y, with the filtered output having a
Downloaded from Digital Engineering Library @ McGraw-Hill (www.digitalengineeringlibrary.com)
Copyright © 2004 The McGraw-Hill Companies. All rights reserved.
Any use is subject to the Terms of Use as given at the website.