
Page 106 - Photodetection and Measurement - Maximizing Performance in Optical Systems
P. 106
System Noise and Synchronous Detection
System Noise and Synchronous Detection 99
S S
q
R sin R
q
R cos q C
C
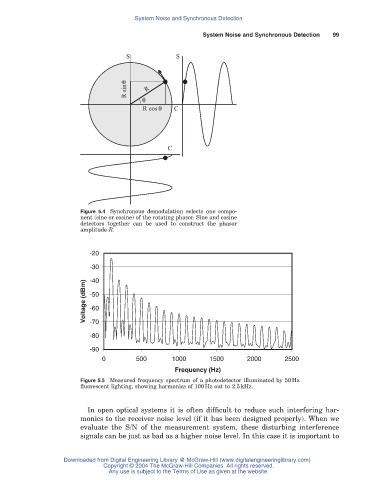
Figure 5.4 Synchronous demodulation selects one compo-
nent (sine or cosine) of the rotating phasor. Sine and cosine
detectors together can be used to construct the phasor
amplitude R.
-20
-30
-40
Voltage (dBm) -50
-60
-70
-80
-90
0 500 1000 1500 2000 2500
Frequency (Hz)
Figure 5.5 Measured frequency spectrum of a photodetector illuminated by 50 Hz
fluorescent lighting, showing harmonics of 100 Hz out to 2.5 kHz.
In open optical systems it is often difficult to reduce such interfering har-
monics to the receiver noise level (if it has been designed properly). When we
evaluate the S/N of the measurement system, these disturbing interference
signals can be just as bad as a higher noise level. In this case it is important to
Downloaded from Digital Engineering Library @ McGraw-Hill (www.digitalengineeringlibrary.com)
Copyright © 2004 The McGraw-Hill Companies. All rights reserved.
Any use is subject to the Terms of Use as given at the website.