
Page 107 - Photodetection and Measurement - Maximizing Performance in Optical Systems
P. 107
System Noise and Synchronous Detection
100 Chapter Five
-50
1172Hz
-60
1100Hz 1200Hz 1300Hz
Voltage (dBm) -70 1250Hz
-80
-90 1150Hz
-100
1050 1100 1150 1200 1250 1300 1350
Frequency (Hz)
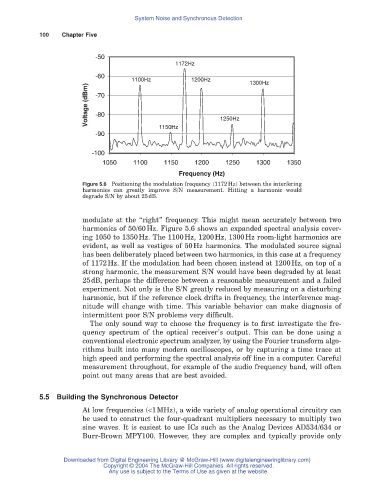
Figure 5.6 Positioning the modulation frequency (1172 Hz) between the interfering
harmonics can greatly improve S/N measurement. Hitting a harmonic would
degrade S/N by about 25 dB.
modulate at the “right” frequency. This might mean accurately between two
harmonics of 50/60Hz. Figure 5.6 shows an expanded spectral analysis cover-
ing 1050 to 1350Hz. The 1100Hz, 1200Hz, 1300Hz room-light harmonics are
evident, as well as vestiges of 50Hz harmonics. The modulated source signal
has been deliberately placed between two harmonics, in this case at a frequency
of 1172Hz. If the modulation had been chosen instead at 1200Hz, on top of a
strong harmonic, the measurement S/N would have been degraded by at least
25dB, perhaps the difference between a reasonable measurement and a failed
experiment. Not only is the S/N greatly reduced by measuring on a disturbing
harmonic, but if the reference clock drifts in frequency, the interference mag-
nitude will change with time. This variable behavior can make diagnosis of
intermittent poor S/N problems very difficult.
The only sound way to choose the frequency is to first investigate the fre-
quency spectrum of the optical receiver’s output. This can be done using a
conventional electronic spectrum analyzer, by using the Fourier transform algo-
rithms built into many modern oscilloscopes, or by capturing a time trace at
high speed and performing the spectral analysis off line in a computer. Careful
measurement throughout, for example of the audio frequency band, will often
point out many areas that are best avoided.
5.5 Building the Synchronous Detector
At low frequencies (<1MHz), a wide variety of analog operational circuitry can
be used to construct the four-quadrant multipliers necessary to multiply two
sine waves. It is easiest to use ICs such as the Analog Devices AD534/634 or
Burr-Brown MPY100. However, they are complex and typically provide only
Downloaded from Digital Engineering Library @ McGraw-Hill (www.digitalengineeringlibrary.com)
Copyright © 2004 The McGraw-Hill Companies. All rights reserved.
Any use is subject to the Terms of Use as given at the website.