
Page 112 - Photodetection and Measurement - Maximizing Performance in Optical Systems
P. 112
System Noise and Synchronous Detection
System Noise and Synchronous Detection 105
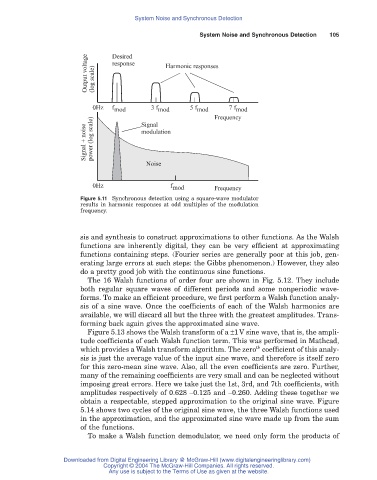
Output voltage (log scale) Desired Harmonic responses
response
7 f
0Hz f mod Signal mod 5 f mod Frequency
3 f
mod
Signal + noise power (log scale) modulation
Noise
0Hz f mod Frequency
Figure 5.11 Synchronous detection using a square-wave modulator
results in harmonic responses at odd multiples of the modulation
frequency.
sis and synthesis to construct approximations to other functions. As the Walsh
functions are inherently digital, they can be very efficient at approximating
functions containing steps. (Fourier series are generally poor at this job, gen-
erating large errors at such steps: the Gibbs phenomenon.) However, they also
do a pretty good job with the continuous sine functions.
The 16 Walsh functions of order four are shown in Fig. 5.12. They include
both regular square waves of different periods and some nonperiodic wave-
forms. To make an efficient procedure, we first perform a Walsh function analy-
sis of a sine wave. Once the coefficients of each of the Walsh harmonics are
available, we will discard all but the three with the greatest amplitudes. Trans-
forming back again gives the approximated sine wave.
Figure 5.13 shows the Walsh transform of a ±1V sine wave, that is, the ampli-
tude coefficients of each Walsh function term. This was performed in Mathcad,
th
which provides a Walsh transform algorithm. The zero coefficient of this analy-
sis is just the average value of the input sine wave, and therefore is itself zero
for this zero-mean sine wave. Also, all the even coefficients are zero. Further,
many of the remaining coefficients are very small and can be neglected without
imposing great errors. Here we take just the 1st, 3rd, and 7th coefficients, with
amplitudes respectively of 0.628 -0.125 and -0.260. Adding these together we
obtain a respectable, stepped approximation to the original sine wave. Figure
5.14 shows two cycles of the original sine wave, the three Walsh functions used
in the approximation, and the approximated sine wave made up from the sum
of the functions.
To make a Walsh function demodulator, we need only form the products of
Downloaded from Digital Engineering Library @ McGraw-Hill (www.digitalengineeringlibrary.com)
Copyright © 2004 The McGraw-Hill Companies. All rights reserved.
Any use is subject to the Terms of Use as given at the website.