Page 113 - Photodetection and Measurement - Maximizing Performance in Optical Systems
P. 113

System Noise and Synchronous Detection

            106   Chapter Five


                        0      2     4     6     8     10    12    14    16
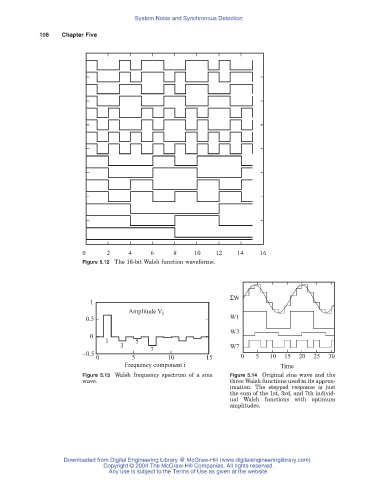
                        Figure 5.12 The 16-bit Walsh function waveforms.


                                                                 SW
                          1
                                     Amplitude V i
                         0.5                                     W1
                                                                 W3
                          0
                              1        5
                                   3                             W7
                                           7
                        -0.5
                            0         5         10        15        0   5   10  15  20  25  30
                                    Frequency component i                      Time
                        Figure 5.13 Walsh frequency spectrum of a sine  Figure 5.14 Original sine wave and the
                        wave.                                    three Walsh functions used in its approx-
                                                                 imation. The stepped response is just
                                                                 the sum of the 1st, 3rd, and 7th individ-
                                                                 ual Walsh functions with optimum
                                                                 amplitudes.


                   Downloaded from Digital Engineering Library @ McGraw-Hill (www.digitalengineeringlibrary.com)
                              Copyright © 2004 The McGraw-Hill Companies. All rights reserved.
                               Any use is subject to the Terms of Use as given at the website.
   108   109   110   111   112   113   114   115   116   117   118