
Page 118 - Photodetection and Measurement - Maximizing Performance in Optical Systems
P. 118
System Noise and Synchronous Detection
System Noise and Synchronous Detection 111
ing some modulation to the beam for detection, but allowing most of the beam
to pass. The effective modulation frequency spectrum can be obtained from the
Fourier transform of the transmitted intensity. The energy at the fundamental
chopper frequency will be greatly reduced and accompanied by strong even and
odd harmonics. This may make life difficult for the lock-in reference channel,
so a square-wave fundamental reference may be needed which reads a differ-
ent part of the wheel from the main beam. More complex choppers consisting
of such coded disks are useful in some experiments.
5.7.2 Setting the detection time constant
The detection time constant can be adjusted on commercial lock-ins over a wide
range, typically from 1ms to 10s. The detection bandwidth is approximately 2¥
the reciprocal of the time constant, and the narrower the bandwidth the less is
the detected noise power. However, the narrower the bandwidth, the slower will
be the response time. As usual, a compromise must be reached. A further con-
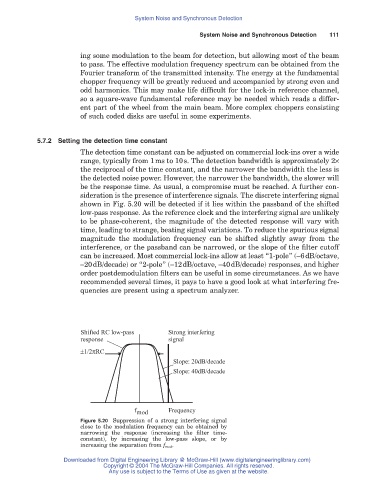
sideration is the presence of interference signals. The discrete interfering signal
shown in Fig. 5.20 will be detected if it lies within the passband of the shifted
low-pass response. As the reference clock and the interfering signal are unlikely
to be phase-coherent, the magnitude of the detected response will vary with
time, leading to strange, beating signal variations. To reduce the spurious signal
magnitude the modulation frequency can be shifted slightly away from the
interference, or the passband can be narrowed, or the slope of the filter cutoff
can be increased. Most commercial lock-ins allow at least “1-pole” (-6dB/octave,
-20dB/decade) or “2-pole” (-12dB/octave, -40dB/decade) responses, and higher
order postdemodulation filters can be useful in some circumstances. As we have
recommended several times, it pays to have a good look at what interfering fre-
quencies are present using a spectrum analyzer.
Shifted RC low-pass Strong interfering
response signal
±1/2pRC
Slope: 20dB/decade
Slope: 40dB/decade
f mod Frequency
Figure 5.20 Suppression of a strong interfering signal
close to the modulation frequency can be obtained by
narrowing the response (increasing the filter time-
constant), by increasing the low-pass slope, or by
increasing the separation from f mod.
Downloaded from Digital Engineering Library @ McGraw-Hill (www.digitalengineeringlibrary.com)
Copyright © 2004 The McGraw-Hill Companies. All rights reserved.
Any use is subject to the Terms of Use as given at the website.