
Page 121 - Photodetection and Measurement - Maximizing Performance in Optical Systems
P. 121
System Noise and Synchronous Detection
114 Chapter Five
connect the detected light to the lock-in input. If you are short of time, just connect
the attenuated variable oscillator to the lock-in input. Fixed and reference oscillators
may be exchanged, as in Fig. 5.22. It is also worth displaying both reference and input
signals on a scope, triggered for example from the lock-in reference. The two signals
are not phase-coherent, but with careful adjustment of the variable oscillator you
should be able to get them within 1Hz of each other or better. On the scope, one
waveform will drift slowly past the other.
Set the lock-in time constant to TC = 1ms, make sure the reference input is locked,
and wind up the input gain to give half of full-scale deflection. The needle of the ampli-
tude display (analog displays are much better for this experiment) should move back
an forth between positive and negative peak values. If the input oscillator is really
well aligned with the crystal reference, the needle may hardly move. At this point the
reference and input frequencies match to much better than 1Hz. With my digitally
adjustable sine-wave input at 7.2009kHz, the needle was barely drifting. Now offset
the frequency as little as possible. If the lock-in is in two-channel XY mode, the two
outputs will increase and decrease periodically as the phase between reference and
input varies. Time the needle oscillation period with a stopwatch, and measure the
input frequency if you can using a digital frequency meter. Adjust the frequency a
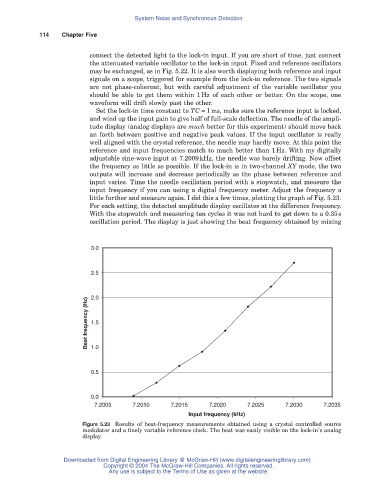
little further and measure again. I did this a few times, plotting the graph of Fig. 5.23.
For each setting, the detected amplitude display oscillates at the difference frequency.
With the stopwatch and measuring ten cycles it was not hard to get down to a 0.35s
oscillation period. The display is just showing the beat frequency obtained by mixing
3.0
2.5
2.0
Beat frequency (Hz) 1.5
1.0
0.5
0.0
7.2005 7.2010 7.2015 7.2020 7.2025 7.2030 7.2035
Input frequency (kHz)
Figure 5.23 Results of beat-frequency measurements obtained using a crystal controlled source
modulator and a finely variable reference clock. The beat was easily visible on the lock-in’s analog
display.
Downloaded from Digital Engineering Library @ McGraw-Hill (www.digitalengineeringlibrary.com)
Copyright © 2004 The McGraw-Hill Companies. All rights reserved.
Any use is subject to the Terms of Use as given at the website.