
Page 124 - Photodetection and Measurement - Maximizing Performance in Optical Systems
P. 124
System Noise and Synchronous Detection
System Noise and Synchronous Detection 117
0
-10
-20
Voltage (dBm) -40
-30
-50
-60
-70
-80
-90
-100
0 200 400 600 800 1000 1200 1400 1600 1800 2000 2200 2400
Frequency (Hz) a
0
-10
-20
Voltage (dBm) -40
-30
-50
-60
-70
-80
-90
-100
0 200 400 600 800 1000 1200 1400 1600 1800 2000 2200 2400
Frequency (Hz) b
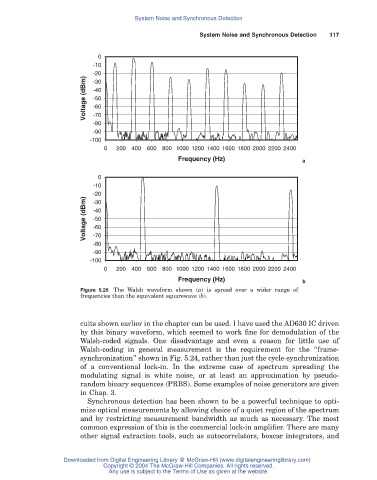
Figure 5.25 The Walsh waveform shown (a) is spread over a wider range of
frequencies than the equivalent squarewave (b).
cuits shown earlier in the chapter can be used. I have used the AD630 IC driven
by this binary waveform, which seemed to work fine for demodulation of the
Walsh-coded signals. One disadvantage and even a reason for little use of
Walsh-coding in general measurement is the requirement for the “frame-
synchronization” shown in Fig. 5.24, rather than just the cycle-synchronization
of a conventional lock-in. In the extreme case of spectrum spreading the
modulating signal is white noise, or at least an approximation by pseudo-
random binary sequences (PRBS). Some examples of noise generators are given
in Chap. 3.
Synchronous detection has been shown to be a powerful technique to opti-
mize optical measurements by allowing choice of a quiet region of the spectrum
and by restricting measurement bandwidth as much as necessary. The most
common expression of this is the commercial lock-in amplifier. There are many
other signal extraction tools, such as autocorrelators, boxcar integrators, and
Downloaded from Digital Engineering Library @ McGraw-Hill (www.digitalengineeringlibrary.com)
Copyright © 2004 The McGraw-Hill Companies. All rights reserved.
Any use is subject to the Terms of Use as given at the website.